
Figure S6
- ID
- ZDB-FIG-210219-23
- Publication
- Prentzell et al., 2021 - G3BPs tether the TSC complex to lysosomes and suppress mTORC1 signaling
- Other Figures
- All Figure Page
- Back to All Figure Page
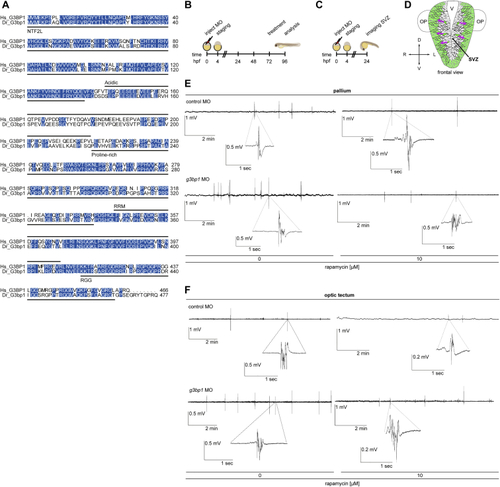
Background information for the zebrafish experiments, related to (A) Sequence alignment of human (Hs) G3BP1 (UniProt: (B) Treatment scheme of the (C) Treatment scheme for the neuronal migration experiments with the (D) Schematic frontal view of the zebrafish front brain at 24 hpf. Green, HuC expressing cells. Magenta arrows, direction of migration from the SVZ to outer layers. V, ventricle; OP, olfactory placodes. (E) LFPs from larval pallia. Representative 10 min recordings of non-invasive LFPs from (F) LFPs from larval optic tecta. Representative 10 min recordings of non-invasive LFPs from |
Reprinted from Cell, 184(3), Prentzell, M.T., Rehbein, U., Cadena Sandoval, M., De Meulemeester, A.S., Baumeister, R., Brohée, L., Berdel, B., Bockwoldt, M., Carroll, B., Chowdhury, S.R., von Deimling, A., Demetriades, C., Figlia, G., Genomics England Research Consortium, de Araujo, M.E.G., Heberle, A.M., Heiland, I., Holzwarth, B., Huber, L.A., Jaworski, J., Kedra, M., Kern, K., Kopach, A., Korolchuk, V.I., van 't Land-Kuper, I., Macias, M., Nellist, M., Palm, W., Pusch, S., Ramos Pittol, J.M., Reil, M., Reintjes, A., Reuter, F., Sampson, J.R., Scheldeman, C., Siekierska, A., Stefan, E., Teleman, A.A., Thomas, L.E., Torres-Quesada, O., Trump, S., West, H.D., de Witte, P., Woltering, S., Yordanov, T.E., Zmorzynska, J., Opitz, C.A., Thedieck, K., G3BPs tether the TSC complex to lysosomes and suppress mTORC1 signaling, 655-674.e27, Copyright (2021) with permission from Elsevier. Full text @ Cell