
Figure 3
- ID
- ZDB-FIG-210219-16
- Publication
- Prentzell et al., 2021 - G3BPs tether the TSC complex to lysosomes and suppress mTORC1 signaling
- Other Figures
- All Figure Page
- Back to All Figure Page
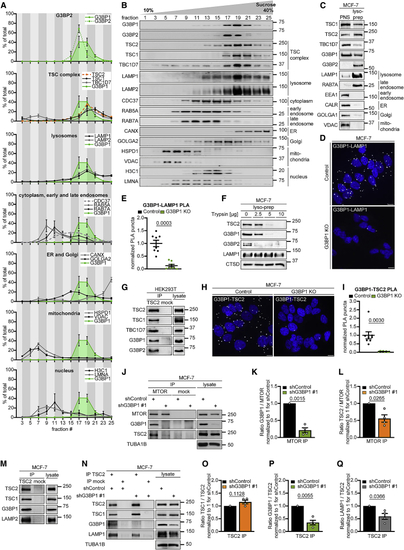
G3BP1 and G3BP2 reside at lysosomes (A) Quantitation of data in (B). G3BP1, green area. Mean ± SEM. (B) Sucrose density gradient separation of serum/aa-starved MCF-7 cells. n = 3. (C) Lyso-prep with ferromagnetic nanoparticles. PNS, postnuclear supernatant. n = 3. (D) PLA of G3BP1-LAMP1 in serum/aa-starved G3BP1 KO cells. PLA puncta, white dots; nuclei, blue (DAPI). Scale bar, 10 μm. n = 3. (E) Quantitation of data in (D). Shown are data points and mean ± SEM. n = 8 technical replicates. (F) Trypsin digest of lyso-preps prepared as in (C). n = 3 except for TSC2 (n = 2). (G) IP against TSC2 (TSC2 #1) or mock (mouse IgG). n = 3. (H) PLA of G3BP1-TSC2 in serum/aa-starved G3BP1 KO cells. PLA puncta, white dots; nuclei, blue (DAPI). Scale bar, 10 μm. n = 4. (I) Quantitation of data in (H). Shown are data points and mean ± SEM. n = 8 technical replicates. (J) IP against MTOR or mock (rat IgG); insulin/aa-stimulated shG3BP1 #1 cells (15 min). n = 4. (K) Quantitation of G3BP1 in (J). Shown are data points and mean ± SEM. (L) Quantitation of TSC2 in (J). Data are shown as in (K). (M) IP against TSC2 (TSC2 #2 or #3) or mock (rabbit IgG). n = 3. (N) IP against TSC2 (TSC2 #2) or mock (rabbit IgG); insulin/aa-stimulated shG3BP1 #1 cells (15 min). n = 4. (O) Quantitation of TSC1 in (N). Shown are data points and mean ± SEM. (P) Quantitation of G3BP1 in (N). Data are shown as in (O). (Q) Quantitation of LAMP1 in (N). Data are shown as in (O). See also |
Reprinted from Cell, 184(3), Prentzell, M.T., Rehbein, U., Cadena Sandoval, M., De Meulemeester, A.S., Baumeister, R., Brohée, L., Berdel, B., Bockwoldt, M., Carroll, B., Chowdhury, S.R., von Deimling, A., Demetriades, C., Figlia, G., Genomics England Research Consortium, de Araujo, M.E.G., Heberle, A.M., Heiland, I., Holzwarth, B., Huber, L.A., Jaworski, J., Kedra, M., Kern, K., Kopach, A., Korolchuk, V.I., van 't Land-Kuper, I., Macias, M., Nellist, M., Palm, W., Pusch, S., Ramos Pittol, J.M., Reil, M., Reintjes, A., Reuter, F., Sampson, J.R., Scheldeman, C., Siekierska, A., Stefan, E., Teleman, A.A., Thomas, L.E., Torres-Quesada, O., Trump, S., West, H.D., de Witte, P., Woltering, S., Yordanov, T.E., Zmorzynska, J., Opitz, C.A., Thedieck, K., G3BPs tether the TSC complex to lysosomes and suppress mTORC1 signaling, 655-674.e27, Copyright (2021) with permission from Elsevier. Full text @ Cell