
|
Figure 1
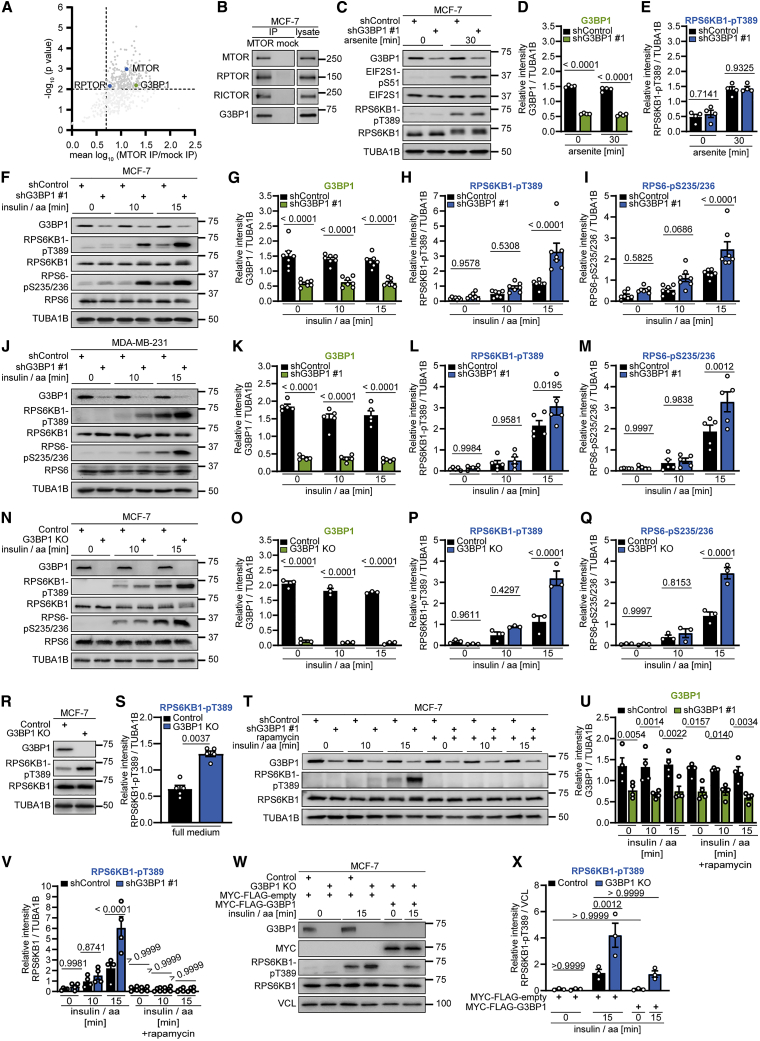
G3BP1 suppresses mTORC1 activation by insulin and nutrients
(A) Re-analysis of the MTOR interactome (
(B) IP against MTOR or mock (rat immunoglobulin G [IgG]). n = 6.
(C) Arsenite-treated shG3BP1 #1 cells. n = 4.
(D) Quantitation of G3BP1 in (C). Shown are data points and mean ± SEM.
(E) Quantitation of RPS6KB1-pT389 in (C). Data are shown as in (D).
(F) Insulin and amino acid (insulin/aa)-stimulated shG3BP1 #1 cells. n = 7.
(G) Quantitation of G3BP1 in (F). Shown are data points and mean ± SEM.
(H) Quantitation of RPS6KB1-pT389 in (F). Data are shown as in (G).
(I) Quantitation of RPS6-pS235/236 in (F). Data are shown as in (G).
(J) Insulin/aa-stimulated shG3BP1 #1 cells. n = 5.
(K) Quantitation of G3BP1 in (J). Shown are data points and mean ± SEM.
(L) Quantitation of RPS6KB1-pT389 in (J). Data are shown as in (K).
(M) Quantitation of RPS6-pS235/236 in (J). Data are shown as in (K).
(N) Insulin/aa-stimulated G3BP1 KO cells. n = 3.
(O) Quantitation of G3BP1 in (N). Shown are data points and mean ± SEM.
(P) Quantitation of RPS6KB1-pT389 in (N). Data are shown as in (O).
(Q) Quantitation of RPS6-pS235/236 in (N). Data are shown as in (O).
(R) Full-medium-cultured G3BP1 KO cells. n = 5.
(S) Quantitation of RPS6KB1-pT389 in (R). Shown are data points and mean ± SEM.
(T) Rapamycin treatment of insulin/aa-stimulated shG3BP1 #1 cells. n = 4.
(U) Quantitation of G3BP1 in (T). Shown are data points and mean ± SEM.
(V) Quantitation of RPS6KB1-pT389 in (T). Data are shown as in (U).
(W) Insulin/aa-stimulated G3BP1 KO cells transfected with MYC-FLAG-G3BP1 (48 h). n = 3.
(X) Quantitation of RPS6KB1-pT389 in (W). Shown are data points and mean ± SEM.
See also
Reprinted from Cell, 184(3), Prentzell, M.T., Rehbein, U., Cadena Sandoval, M., De Meulemeester, A.S., Baumeister, R., Brohée, L., Berdel, B., Bockwoldt, M., Carroll, B., Chowdhury, S.R., von Deimling, A., Demetriades, C., Figlia, G., Genomics England Research Consortium, de Araujo, M.E.G., Heberle, A.M., Heiland, I., Holzwarth, B., Huber, L.A., Jaworski, J., Kedra, M., Kern, K., Kopach, A., Korolchuk, V.I., van 't Land-Kuper, I., Macias, M., Nellist, M., Palm, W., Pusch, S., Ramos Pittol, J.M., Reil, M., Reintjes, A., Reuter, F., Sampson, J.R., Scheldeman, C., Siekierska, A., Stefan, E., Teleman, A.A., Thomas, L.E., Torres-Quesada, O., Trump, S., West, H.D., de Witte, P., Woltering, S., Yordanov, T.E., Zmorzynska, J., Opitz, C.A., Thedieck, K., G3BPs tether the TSC complex to lysosomes and suppress mTORC1 signaling, 655-674.e27, Copyright (2021) with permission from Elsevier. Full text @ Cell