
- Title
-
Foxc1 establishes enhancer accessibility for craniofacial cartilage differentiation
- Authors
- Xu, P., Yu, H.V., Tseng, K.C., Flath, M., Fabian, P., Segil, N., Crump, J.G.
- Source
- Full text @ Elife

(A) Confocal image of facial cartilages expressing col2a1a:GFP and sox10:Dsred at 72 hpf. Lateral view with anterior to left. Scale bar = 100 μm. (B) Venn diagram indicating distal elements with open chromatin accessibility in col2a1a:GFP+; sox10:Dsred+ versus col2a1a:GFP−; sox10:Dsred− cells. (C) Peak intensity plots (heatmap) of μATACseq show differentially enriched open chromatin regions in double-positive versus double-negative cells. (D) The top five transcription factor (TF) motifs recovered from the top 2000 μATACseq peaks enriched in chondrocytes (after removing redundant motifs). (E) GO analysis of nearest neighbor genes of μATACseq peaks enriched in chondrocytes. |

( |
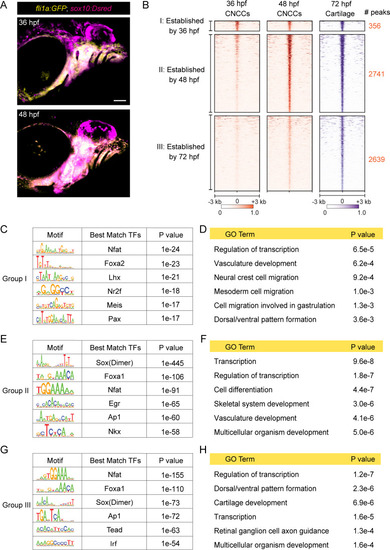
(A) Confocal images of CNCCs expressing fli1a:GFP and sox10:Dsred at 36 and 48 hpf. Lateral view with anterior to left. Scale bar = 100 μm. (B) Peak intensity plots of cartilage-accessible distal elements shown for chondrocytes at 72 hpf and CNCCs at 36 and 48 hpf. Chondrocyte accessible elements are pooled into three categories based on dynamics of chromatin accessibility across stages. (C, E, G) De novo motif enrichment recovered by Homer analysis among the three categories. Top six motifs are shown with associated p values after removing redundant motifs. (D, F, H) GO term analysis among the three categories. |
( |
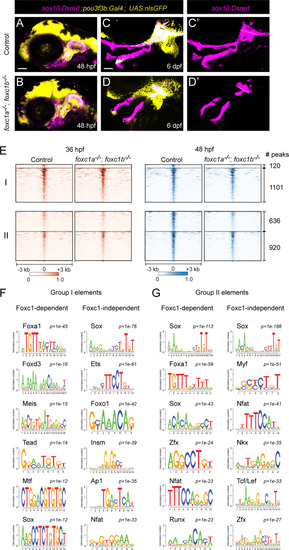
(A,B) Confocal images show dorsal CNCCs of the first two arches labeled by sox10:Dsred and pou3f3b:Gal4; UAS:nlsGFP in control and foxc1a–/–; foxc1b–/– mutant embryos at 48 hpf. Scale bar = 100 μm. (C,D) Confocal images show loss of dorsal cartilages in foxc1a–/–; foxc1b–/– mutant embryos at 6 dpf. sox10:Dsred+ cartilages are seen in single channels in C’ and D’, with dashed lines highlighting boundaries of dorsal arch and otic cartilage. (E) Peak intensity plots of Group I and Group II elements in control and foxc1a–/–; foxc1b–/– mutant embryos. Peaks above the dashed lines are reduced in mutants. (F,G) De novo motif enrichment of Foxc1-dependent and Foxc1-independent Group I and Group II elements. Top six motifs are shown with associated p-values after removing redundant motifs. |
( |
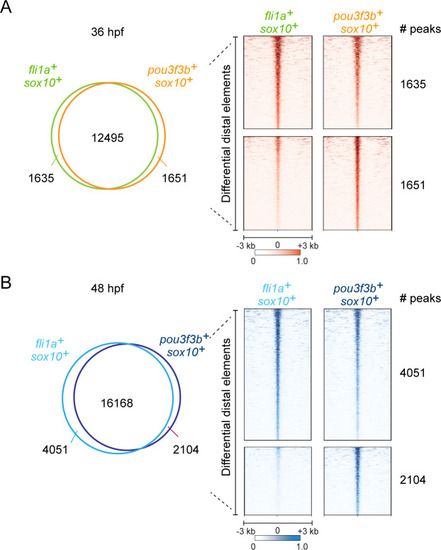
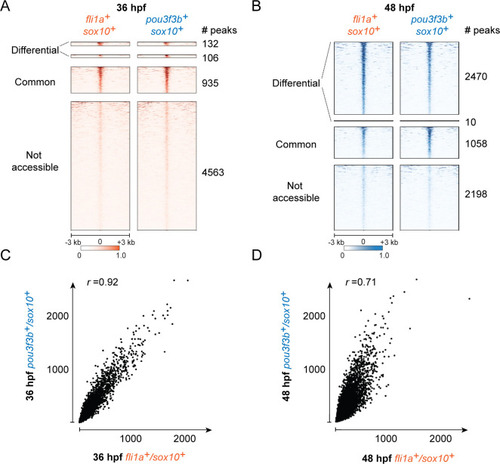
Venn diagrams and heatmaps show distal accessible elements in μATACseq data from |
( |
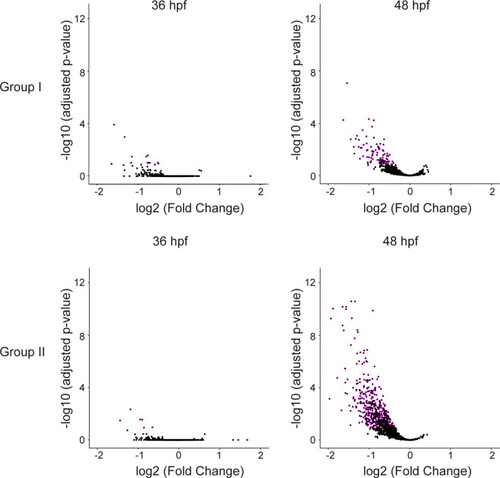
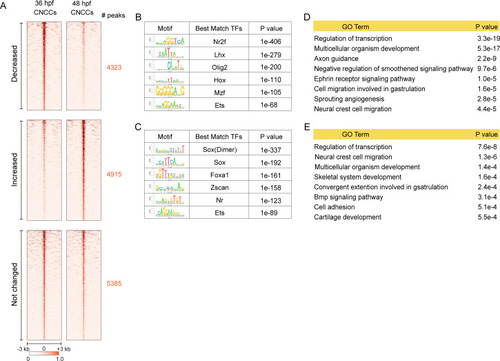
Comparison of the chromatin accessibility of Group I and Group II peaks between wild types and FoxC mutant CNCCs. The x-axis represents the log2 fold change value of mutant versus control peaks, and the y-axis represents the −log10 adjusted p values associated with these regions. Peaks above a −log10 adjusted p value of 1 (purple dots) are considered significant. Many more peaks display decreased accessibility at 48 hpf than at 36 hpf in Foxc1 mutants. |
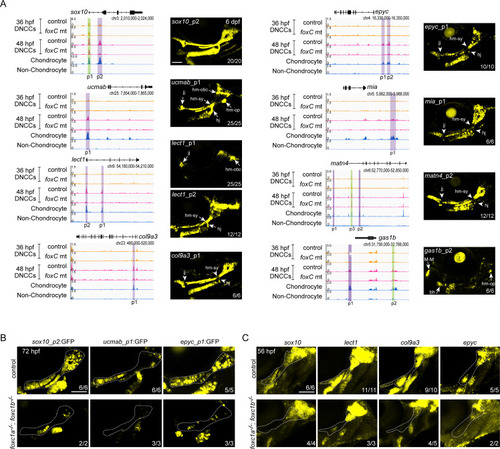
(A) Genomic regions (gene loci and GRCz10 coordinates listed) for enhancer testing on the left and GFP expression driven by the indicated peaks in stable transgenic zebrafish at 6 dpf on the right. Peaks (p) tested are shown, with Foxc1-dependent regions in purple and Foxc1-independent elements in green. μATACseq reads are shown in each row, with chondrocyte and non-chondrocyte peaks from 72 hpf embryos. Confocal projections show cartilages of the first two arches in lateral view with anterior to the left. Arrows indicate enriched expression at joint regions, and arrowheads denote relative lack of expression. (B) Confocal projections show selective loss of sox10_p2:EGFP, ucmab_p1:EGFP, and epyc_p1:EGFP transgene expression in the dorsal cartilage domains (dashed outlines) of foxc1a−/−; foxc1b−/− mutants at 72 hpf. (C) Confocal projections of in situ hybridization show selective loss of sox10, lect1, col9a3, and epyc in the dorsal cartilage domain (dashed outline) of foxc1a−/−; foxc1b−/− mutants at 56 hpf. Numbers indicate proportion of embryos in which the displayed patterns were observed. bh, basihyal; DNCCs, dorsal CNCCs; jj, jaw joint; hj, hyoid joint; hm-op, hyomandibular-opercular joint; hm-otic, hyomandibular-otic junction; hm-sy, hyomandibular-symplectic junction; M-M, Meckel’s–Meckel’s joint. Scale bars = 100 μm. |

( |

( |