
Figure 4
- ID
- ZDB-IMAGE-210224-36
- Publication
- Xu et al., 2021 - Foxc1 establishes enhancer accessibility for craniofacial cartilage differentiation
- All Figures
- Figures for Xu et al., 2021
|
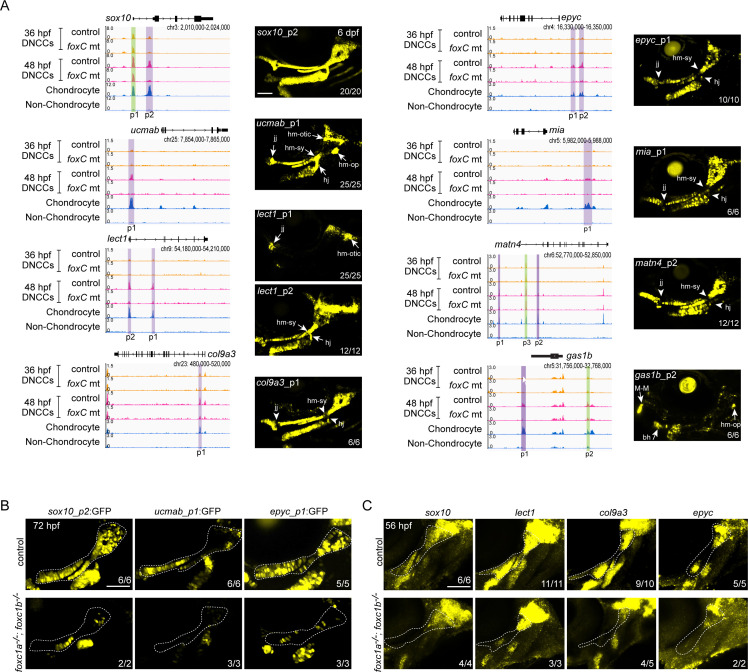
Figure 4 (A) Genomic regions (gene loci and GRCz10 coordinates listed) for enhancer testing on the left and GFP expression driven by the indicated peaks in stable transgenic zebrafish at 6 dpf on the right. Peaks (p) tested are shown, with Foxc1-dependent regions in purple and Foxc1-independent elements in green. μATACseq reads are shown in each row, with chondrocyte and non-chondrocyte peaks from 72 hpf embryos. Confocal projections show cartilages of the first two arches in lateral view with anterior to the left. Arrows indicate enriched expression at joint regions, and arrowheads denote relative lack of expression. (B) Confocal projections show selective loss of sox10_p2:EGFP, ucmab_p1:EGFP, and epyc_p1:EGFP transgene expression in the dorsal cartilage domains (dashed outlines) of foxc1a−/−; foxc1b−/− mutants at 72 hpf. (C) Confocal projections of in situ hybridization show selective loss of sox10, lect1, col9a3, and epyc in the dorsal cartilage domain (dashed outline) of foxc1a−/−; foxc1b−/− mutants at 56 hpf. Numbers indicate proportion of embryos in which the displayed patterns were observed. bh, basihyal; DNCCs, dorsal CNCCs; jj, jaw joint; hj, hyoid joint; hm-op, hyomandibular-opercular joint; hm-otic, hyomandibular-otic junction; hm-sy, hyomandibular-symplectic junction; M-M, Meckel’s–Meckel’s joint. Scale bars = 100 μm.