
Figure 2
- ID
- ZDB-FIG-210224-27
- Publication
- Xu et al., 2021 - Foxc1 establishes enhancer accessibility for craniofacial cartilage differentiation
- Other Figures
- All Figure Page
- Back to All Figure Page
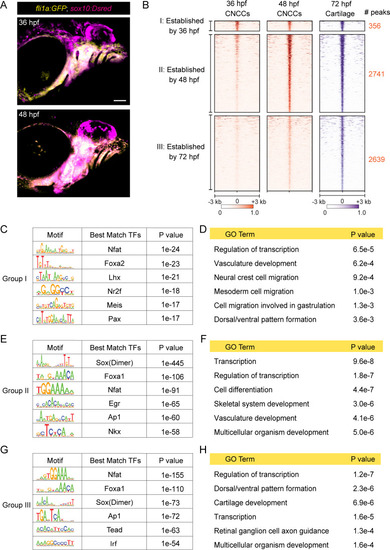
(A) Confocal images of CNCCs expressing fli1a:GFP and sox10:Dsred at 36 and 48 hpf. Lateral view with anterior to left. Scale bar = 100 μm. (B) Peak intensity plots of cartilage-accessible distal elements shown for chondrocytes at 72 hpf and CNCCs at 36 and 48 hpf. Chondrocyte accessible elements are pooled into three categories based on dynamics of chromatin accessibility across stages. (C, E, G) De novo motif enrichment recovered by Homer analysis among the three categories. Top six motifs are shown with associated p values after removing redundant motifs. (D, F, H) GO term analysis among the three categories. |