
IMAGE
Figure 3—figure supplement 4.
- ID
- ZDB-IMAGE-210224-35
- Publication
- Xu et al., 2021 - Foxc1 establishes enhancer accessibility for craniofacial cartilage differentiation
- All Figures
- Figures for Xu et al., 2021
Image
|
Figure Caption
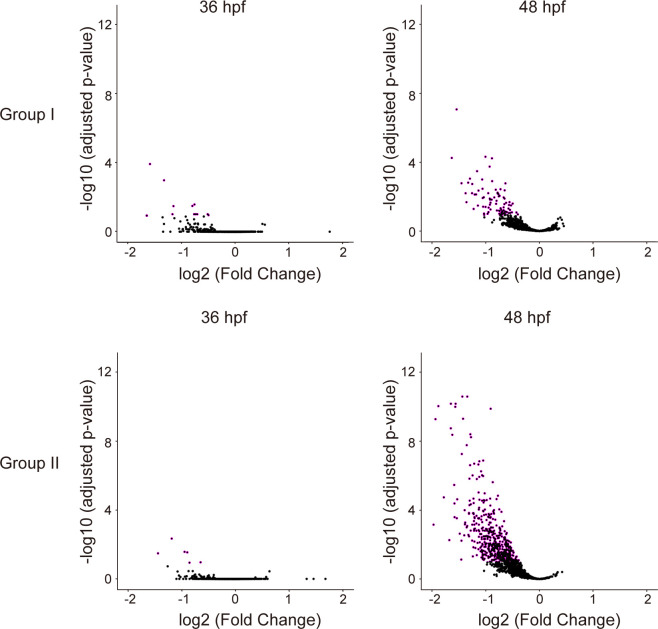
Figure 3—figure supplement 4.
Comparison of the chromatin accessibility of Group I and Group II peaks between wild types and FoxC mutant CNCCs. The x-axis represents the log2 fold change value of mutant versus control peaks, and the y-axis represents the −log10 adjusted p values associated with these regions. Peaks above a −log10 adjusted p value of 1 (purple dots) are considered significant. Many more peaks display decreased accessibility at 48 hpf than at 36 hpf in Foxc1 mutants.
Acknowledgments
This image is the copyrighted work of the attributed author or publisher, and
ZFIN has permission only to display this image to its users.
Additional permissions should be obtained from the applicable author or publisher of the image.
Full text @ Elife