
Figure 3
- ID
- ZDB-IMAGE-210224-32
- Publication
- Xu et al., 2021 - Foxc1 establishes enhancer accessibility for craniofacial cartilage differentiation
- All Figures
- Figures for Xu et al., 2021
|
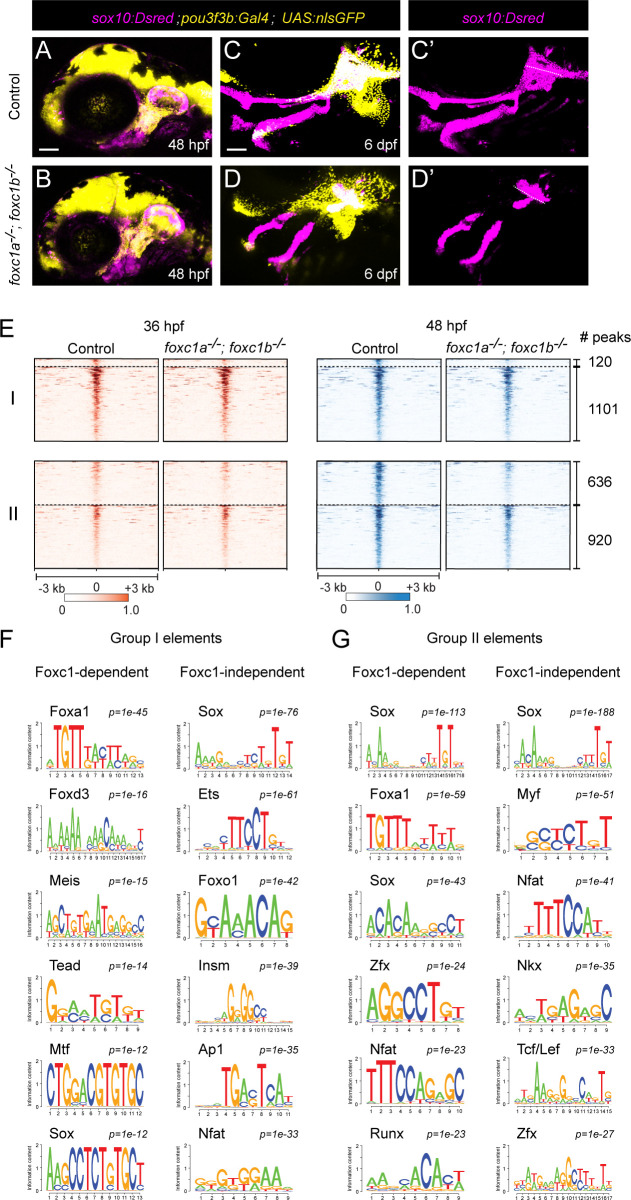
Figure 3 (A,B) Confocal images show dorsal CNCCs of the first two arches labeled by sox10:Dsred and pou3f3b:Gal4; UAS:nlsGFP in control and foxc1a–/–; foxc1b–/– mutant embryos at 48 hpf. Scale bar = 100 μm. (C,D) Confocal images show loss of dorsal cartilages in foxc1a–/–; foxc1b–/– mutant embryos at 6 dpf. sox10:Dsred+ cartilages are seen in single channels in C’ and D’, with dashed lines highlighting boundaries of dorsal arch and otic cartilage. (E) Peak intensity plots of Group I and Group II elements in control and foxc1a–/–; foxc1b–/– mutant embryos. Peaks above the dashed lines are reduced in mutants. (F,G) De novo motif enrichment of Foxc1-dependent and Foxc1-independent Group I and Group II elements. Top six motifs are shown with associated p-values after removing redundant motifs.