
Figure 1
- ID
- ZDB-IMAGE-210224-4
- Publication
- Xu et al., 2021 - Foxc1 establishes enhancer accessibility for craniofacial cartilage differentiation
- All Figures
- Figures for Xu et al., 2021
|
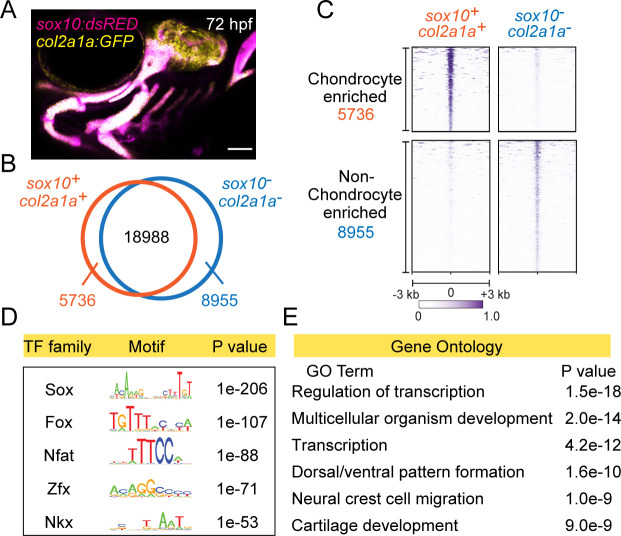
Figure 1 (A) Confocal image of facial cartilages expressing col2a1a:GFP and sox10:Dsred at 72 hpf. Lateral view with anterior to left. Scale bar = 100 μm. (B) Venn diagram indicating distal elements with open chromatin accessibility in col2a1a:GFP+; sox10:Dsred+ versus col2a1a:GFP−; sox10:Dsred− cells. (C) Peak intensity plots (heatmap) of μATACseq show differentially enriched open chromatin regions in double-positive versus double-negative cells. (D) The top five transcription factor (TF) motifs recovered from the top 2000 μATACseq peaks enriched in chondrocytes (after removing redundant motifs). (E) GO analysis of nearest neighbor genes of μATACseq peaks enriched in chondrocytes.