
Figure 3—figure supplement 1.
- ID
- ZDB-FIG-210224-29
- Publication
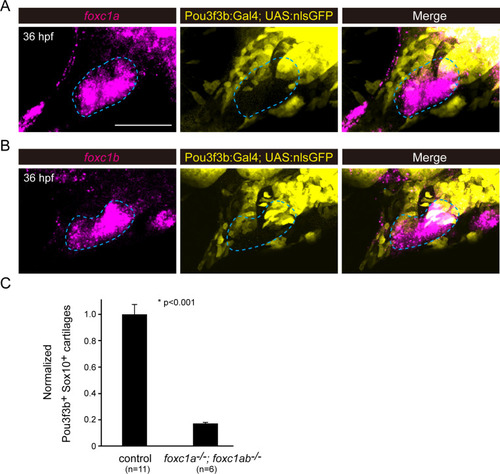
- Xu et al., 2021 - Foxc1 establishes enhancer accessibility for craniofacial cartilage differentiation
- Other Figures
- All Figure Page
- Back to All Figure Page
( |