
- Title
-
Effects of gonadotropin-inhibitory hormone on early and late stages of spermatogenesis in ex-vivo culture of zebrafish testis
- Authors
- Fallah, H.P., Rodrigues, M.S., Zanardini, M., Nóbrega, R.H., Habibi, H.R.
- Source
- Full text @ Mol. Cell. Endocrinol.
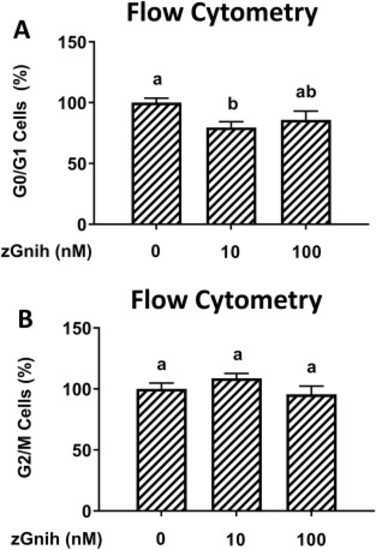
Fig. 1. (A–B) Concentration-related effects of zGnih (nM) on G0/G1 and G2/M cells. Following 7-days treatment ex vivo, zebrafish testes were dissociated and assayed for FACScan analysis by FCM. The percentage of diploid cells was determined by BD CellQuest Pro for 0, 10, 100 nM zGnih treatments (mean ± SEM; n = 5). Counts were normalized to 100%, and treatment groups were normalized against basal control (L-15 medium). Results were analyzed by ANOVA followed by Tukey's multiple comparison tests. values with dissimilar superscripts are significantly different (P ≤ 0.05). |
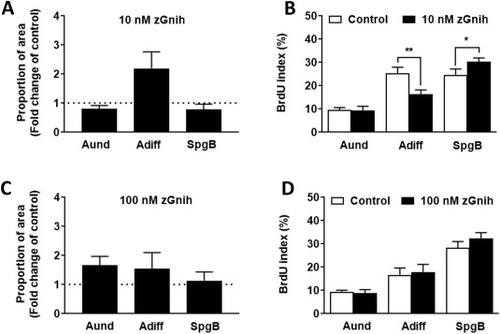
Fig. 2. A and D show the effects of zGnih on spermatogenesis after 7-days of zebrafish testis tissue culture. (A and C) Proportion of A undifferentiated spermatogonia (Aund), type A differentiated (Adiff) and type B spermatogonia (SpgB) were determined in the section surface area within the spermatogenic cysts in the absence (dotted line) or presence (black bars) of (A) 10 nM zGnih and (C) 100 nM zGnih. Results were analyzed by Student's T-test (n = 5) and presented as fold changes with respect to the control group (basal). Values are mean ± SEM, and sterisks represent significant difference from the basal shown as dotted line. B and D show incorporation of BrdU (5-Bromo-2′-Deoxyuridine) during the last 6 h of 7-days culture. BrdU labeling index of Aund, Adiff, and SpgB cells were determined in the cultured testes in the absence and presence of 10 and 100 nM zGnih. Bars show the mean ± SEM (n = 5). Each treatment was compared with its own (individual) control (contralateral testis). Asterisks over connected line denote statistical significance between the control and treatment group, using Student's T-test. |
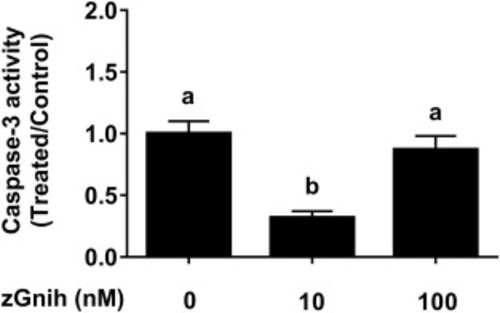
Fig. 3. Caspase-3 (protease) activity of testis cultured in the presence of 0, 10, and 100 nM of zGnih for 24 h. Following a one-day incubation of the testes, the Caspase-3 activity was measured for every single tissue using the tissue lysate by the EnzChek Caspase-3 Kit#2 with Z-DEVD-R110 substrate (Catalog no. E13184). Reactions were carried out at room temperature, and the fluorescence signal was measured at 496/521 nm (excitation/emission) in the Spectra iMax3 Fluorometer. Data were then normalized by milligrams of the testis, and values are expressed as relative fold change of control (mean ± SEM; n = 6). Results were analyzed by ANOVA followed by Tukey's multiple comparison tests. Values with dissimilar superscripts are significantly different (P ≤ 0.05). |
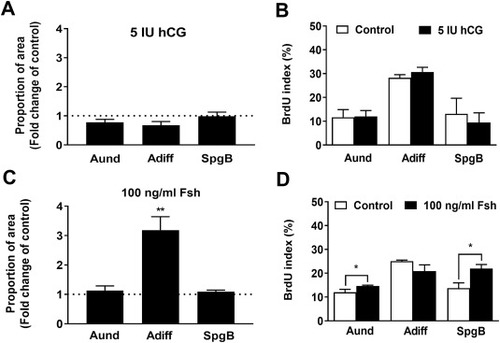
Fig. 4. A and D show the effects of 5 IU/ml hCG and 100 ng/ml Fsh on spermatogenesis after 7-days of zebrafish testis tissue culture on spermatogonial proliferation. (A and C) Proportion of type A undifferentiated spermatogonia (Aund), type A differentiated (Adiff) and type B spermatogonia (SpgB) were determined in the section surface area within the spermatogenic cysts in the absence (dotted line) or presence (black bars) of (A) 5 IU/ml hCG and (C) 100 ng/ml Fsh. Results were analyzed by Student's T-test (n = 5) and presented as fold changes with respect to the control group (basal). Values are mean ± SEM, and sterisks represent significant difference from the basal shown as dotted line. B and D show BrdU-incorporation during the last 6 h of 7-days testis culture. BrdU positive germ cells: Aund, Adiff and SpgB were counted in the testes incubated in culture medium in the presence of (B) 5 IU/ml hCG and (D) 100 ng/ml of Fsh. (B–D) BrdU labeling index of Aund, Adiff, and SpgB. Bars show the mean ± SEM (n = 5). Each treatment was compared with its own (individual) control (contralateral testis). Asterisks over connected line denote statistical significance between the control and treatment group, using Student's T-test. |
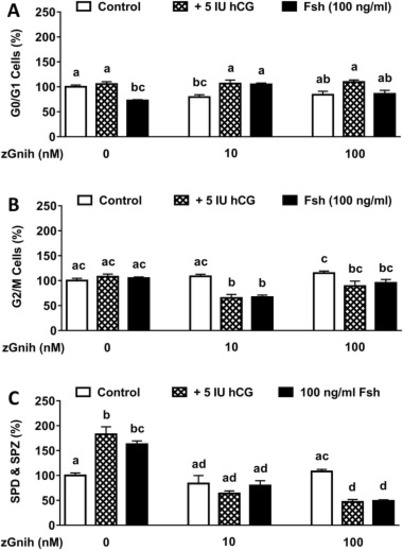
Fig. 5. (A–C) Ex vivo effects of 0, 10 and 100 nM zGnih alone or in combination with 5 IU/ml hCG and 100 ng/ml (Fsh) on zebrafish spermatogenesis (G0/G1) cells (A), G2/M cells (B), spermatids (SPD) and spermatozoa (SPZ) cell populations (C). Zebrafish testes were dissociated after 7 days culture and assayed using FACScan analysis by FCM. The percentage of diploid and haploid cells were determined by BD CellQuest Pro for 0, 10, 100 nM zGnih treatments (mean ± SEM; n = 5). Counts were normalized to 100%, and treatment groups were normalized against their basal controls. Results were analyzed by ANOVA followed by Tukey's multiple comparison tests. Values with dissimilar superscripts are significantly different (P ≤ 0.05). |
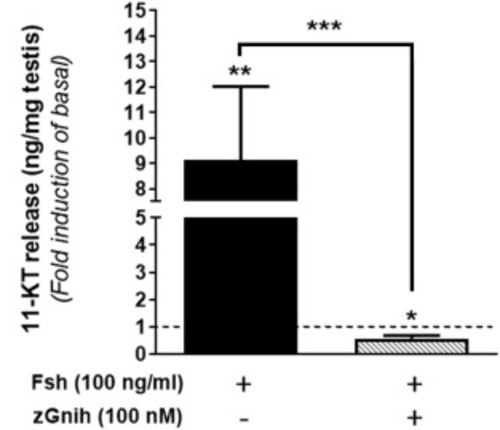
Fig. 6. Concentration of 11-KT (11-Ketotestosterone) (ng/mg of testis weight) measured in the incubation media after short-term exposure (18 h) in the presence of 100 ng/ml Fsh with or without 100 nM zGnih. Bars represent mean ± SEM (n = 8). Values were normalized with respect to weight of testis and expressed as relative fold change of the basal control shown as dotted line. Asterisks over each column represents differences with respect to basal control. Asterisks over connected line between the two treatments (black bar: 100 ng/ml Fsh; grey bar: 100 ng/ml of Fsh + 100 nM zGnih) shows significant difference between the two treatment groups as shown, using Student's T-test (*p < 0.05; **p < 0.01; ***p < 0.001). |
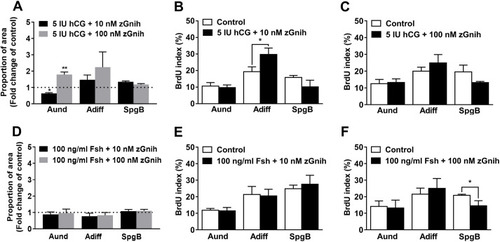
Fig. 7. (A and D) Proportion of type A undifferentiated spermatogonia (Aund), type A differentiated (Adiff) and type B spermatogonia (SpgB) were determined in the section surface area within the spermatogenic cysts in the absence (dotted line) or following various treatments as shown. Bars show the mean ± SEM (t-test; n = 5) and asterisks indicate significant difference with respect to basal control (dotted line), using Student paired t-test (n = 5). B, C, E and F show BrdU-incorporation during the last 6 h of 7-days testis culture. BrdU positive germ cells: Aund, Adiff and SpgB were counted in the testes. BrdU positive germ cells: Aund, Adiff and SpgB were counted in the testes following various treatments shown. Bars shows mean ± SEM (n = 5). Each treatment was compared with its own (individual) control (contralateral testis). Asterisks over connected line denote statistical significance between the control and treatment group, using Student's T-test. |
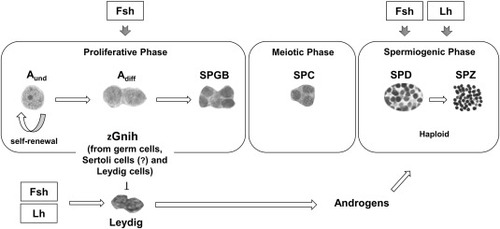
Fig. 8. A proposed model of the paracrine effects of zGnih and gonadotropins (Lh and Fsh) on zebrafish spermatogenesis. The figure illustrates the progression of spermatogenesis from type A undifferentiated spermatogonia to haploid spermatozoa cells in the presence of locally produced zGnih peptides from germ cells, Sertoli cells, and Leydig cells (Fallah et al., 2019). The diagram also illustrates the involvement of Leydig cells in the production of androgens leading to cellular differentiation, meiosis and spermiogenesis. Lh and Fsh signaling both stimulate spermatogenesis; however, they differentially regulate this process and function on different phases of spermatogenesis. zGnih is capable of inhibiting both Lh and Fsh induced-spermatogenesis by altering the number of spermatogonia cells and their proliferative activity or affecting the androgen production. Blocked lines represent inhibition. Aund: type A undifferentiated spermatogonia, Adiff: type A differentiated spermatogonia, B: type B spermatogonia, SPC: spermatocytes, SPD: spermatids, SPZ: spermatozoa. |
Reprinted from Molecular and Cellular Endocrinology, 520, Fallah, H.P., Rodrigues, M.S., Zanardini, M., Nóbrega, R.H., Habibi, H.R., Effects of gonadotropin-inhibitory hormone on early and late stages of spermatogenesis in ex-vivo culture of zebrafish testis, 111087, Copyright (2020) with permission from Elsevier. Full text @ Mol. Cell. Endocrinol.