
Image
|
Figure Caption
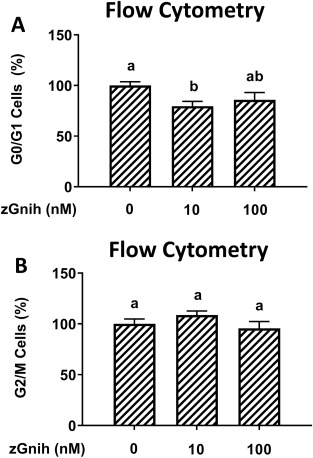
Fig. 1 Fig. 1. (A–B) Concentration-related effects of zGnih (nM) on G0/G1 and G2/M cells. Following 7-days treatment ex vivo, zebrafish testes were dissociated and assayed for FACScan analysis by FCM. The percentage of diploid cells was determined by BD CellQuest Pro for 0, 10, 100 nM zGnih treatments (mean ± SEM; n = 5). Counts were normalized to 100%, and treatment groups were normalized against basal control (L-15 medium). Results were analyzed by ANOVA followed by Tukey's multiple comparison tests. values with dissimilar superscripts are significantly different (P ≤ 0.05).
Acknowledgments
This image is the copyrighted work of the attributed author or publisher, and
ZFIN has permission only to display this image to its users.
Additional permissions should be obtained from the applicable author or publisher of the image.
Reprinted from Molecular and Cellular Endocrinology, 520, Fallah, H.P., Rodrigues, M.S., Zanardini, M., Nóbrega, R.H., Habibi, H.R., Effects of gonadotropin-inhibitory hormone on early and late stages of spermatogenesis in ex-vivo culture of zebrafish testis, 111087, Copyright (2020) with permission from Elsevier. Full text @ Mol. Cell. Endocrinol.