
- Title
-
An improved zebrafish transcriptome annotation for sensitive and comprehensive detection of cell type-specific genes
- Authors
- Lawson, N.D., Li, R., Shin, M., Grosse, A., Yukselen, O., Stone, O.A., Kucukural, A., Zhu, L.
- Source
- Full text @ Elife

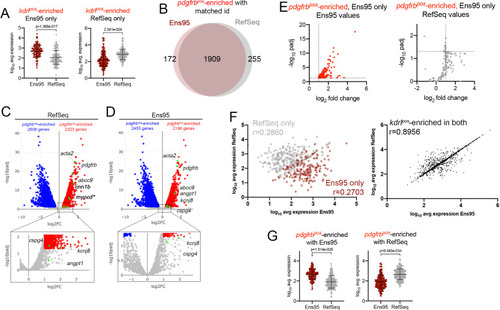
(A, B) Volcano plots showing differentially expressed genes from Tg(kdrl:HRAS-mCherry)s896-positive and negative (kdrlpos and kdrlneg) cells identified using RNA-seq reads quantified with (A) RefSeq or (B) Ensembl, version 95 (Ens95) transcript annotations. Genes with significant enrichment (padj <0.05) are shown as red or blue (log2 fold change >1 or <-1, respectively) across replicate samples (n = 3). Grey dots are genes that fall below statistical cutoffs. Green dots indicate selected genes previously found to be enriched in endothelial cells in zebrafish or other models. (C) Venn diagram illustrating the intersection of genes with a common NCBI ID in Ens95 and RefSeq found significantly enriched in kdrlpos cells using either annotation. (D, E) Plots of commonly annotated genes identified as kdrlpos-enriched only by Ens95 with indicated values from (D) Ens95 or (E) RefSeq. (F, G) Correlation of expression levels from indicated annotation for kdrlpos-enriched genes identified (F) selectively as such by Ens95 (maroon) or RefSeq (grey) only, or (G) both annotations. Data are not normally distributed, Spearman correlation, r values are indicated. |
(A) Log10 average expression (n = 3) for kdrlpos-enriched genes as quantified by each indicated annotation. Each separate plot shows genes identified as kdrlpos-enriched only using or Ens95 or RefSeq. Data are not normally distributed, Wilcoxon matched-pairs signed-rank test, p values are indicated. (B) Venn diagram of intersection for genes with a common NCBI ID in Ens95 and RefSeq found significantly enriched in pdgfrbpos cells (log2 fold change [pdgfrbpos/pdgfrbneg]>1,adjp <0.05) using each annotation. (C, D) Volcano plots showing differentially expressed genes from TgBAC(pdgfrb:citrine)s1010-positive and negative cells identified using RNA-seq reads quantified using (C) RefSeq or (D) Ens95 annotations. Genes with significant differences (padj <0.05) are shown as red (log2 fold change >1) or blue (log2 fold change<-1). Grey dots are genes that fall below these statistical cutoffs; n = 3. Green dots indicate selected genes previously identified as expressed in vascular smooth muscle cells or pericytes (see main text). (E) Plots of commonly annotated genes identified as pdgfrbpos-enriched only by Ens95 with indicated values from Ens95 or RefSeq. (F) Correlation of expression levels from indicated annotation for pdgfrbpos-enriched genes identified selectively as such by Ens95 (maroon) or RefSeq (grey) only (left plot) or in both annotations (right plot). Data are not normally distributed, Spearman correlation, r values are indicated. (G) Log10 average expression (n = 3) for pdgfrbpos-enriched genes as quantified by each indicated annotation. Each separate plot shows genes only identified as pdgfrbpos-enriched using Ens95 or RefSeq. Data are not normally distributed, Wilcoxon matched-pairs signed-rank test, p values are indicated. |

(A, B) Plots showing 3' UTR length from matched reference genes from indicated annotation identified as enriched only in Ens95 or RefSeq. Mean 3' UTR length for each group is shown, error bars denote mean and standard deviation. No statistical comparison is presented since these data are already defined as longer (>50 nt) in indicated annotation. (A) kdrlpos-enriched genes. (B) pdgfrbpos-enriched genes. |

( |
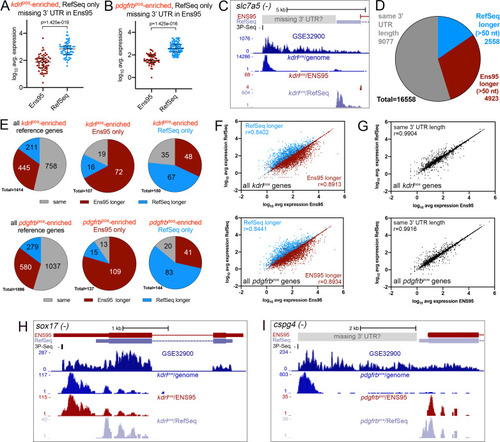
(A, B) Log10 average expression as quantified using indicated annotation for (A) kdrlpos- or (B) pdgfrbpos-enriched genes identified as such only in RefSeq and lacking an Ens95 3' UTR annotation. Expression levels for genes from each annotation with matched NCBI ID are shown in each case. Data are normally distributed (Shapiro-Wilks test), paired t-test, p values are indicated; n = 3 (i.e. each point represents an average value from three separate RNA-seq replicates). (C) UCSC browser image of slc7a5 locus on the minus strand showing 3' UTR annotations from Ens95 and RefSeq. Mapped read depth from kdrlpos cells on the genome, or assigned to each annotation are indicated, as is a 3P-seq feature. The GSE32900 track is consolidated RNA-seq reads from all stages indicated in Figure 3A. The location of a putative missing 3' UTR is indicated. (D) Pie chart showing numbers of reference genes with the same or longer 3' UTRs in each indicated annotation. (E) Pie charts showing the proportion of reference genes selectively identified as kdrlpos- or pdgfrbpos-enriched by Ens95 and RefSeq with indicated relative 3' UTR length. (F, G) Correlation plots showing log10 average expression from kdrlpos RNA-seq (n = 3) quantified with each annotation for matched reference genes with (F) longer Ens95 (maroon) or RefSeq (light blue) 3' UTR, or (G) same 3' UTR length. Data are not normally distributed, Spearman correlation, r values are indicated. (H, I) UCSC browser images of (H) sox17 and (I) cspg4 loci, both on the minus strand, showing 3' UTR annotations from Ens95 and RefSeq. Mapped read depth of RNA-seq from (H) kdrlpos or (I) pdgfrbpos cells captured for each annotation is indicated. Consolidated reads from GSE32900 and location of 3P-Seq features are indicated, as is putative missing 3' UTR in cspg4. |
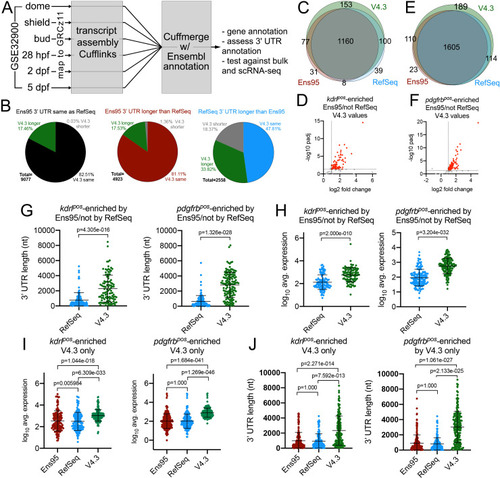
(A) Schematic outline for generating a new zebrafish transcriptome annotation. See Results and Materials and methods sections for details. (B) Pie charts showing the proportion of reference genes with same, longer or shorter 3' UTR in the V4.3 annotation compared to relative 3' UTR length between Ens95 and RefSeq. (C, E) Venn diagrams showing intersection of reference genes with commonly annotated NCBI ID that are significantly enriched in (C) kdrlpos- or (E) pdgfrbpos-cells in each indicated annotation. (D, F) Volcano plots of reference genes with common NCBI ID identified as (D) kdrlpos- or (F) pdgfrbpos-enriched only by Ens95 in comparison to RefSeq. Indicated values are from the same genes quantified using V4.3. Red dots indicate log2 fold change >1 and adjp <0.05. (G) 3' UTR lengths and (H) log10 average expression (n = 3) using RefSeq and V4.3 for reference genes in the indicated dataset. (G, H) Data are not normally distributed, Wilcoxon matched-pairs signed-rank test, p values are indicated. Error bars denote mean and standard deviation. (I) Log10 average expression (n = 3) and (J) 3' UTR lengths across all annotations for reference genes uniquely identified as enriched in indicated transgene-positive cell type using V4.3 (log2 fold change >1, padj <0.05). Data are not normally distributed. Friedman test to assess variance (p<0.0001 in all cases). Dunn's multiple comparison test was used for pairwise comparisons, p values are indicated. Error bars denote mean and standard deviation. |

( |

( |

( |
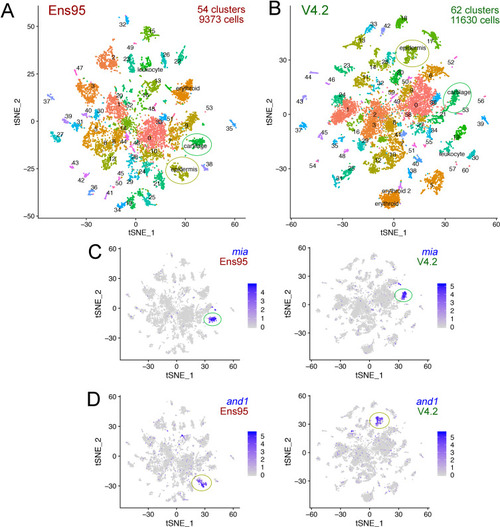
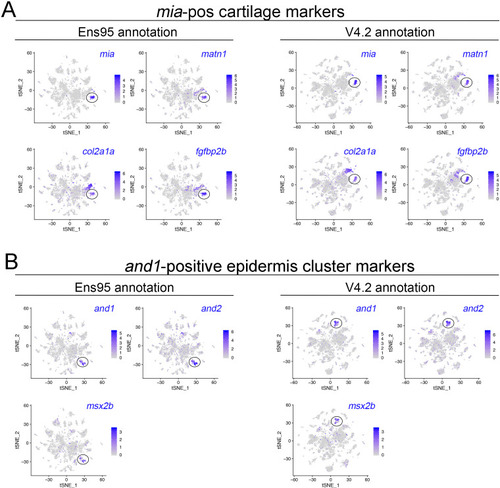
(A, B) tSNE plots of cells from 5 day post fertilization (dpf) zebrafish embryos from the same mapped scRNA-seq reads quantified with (A) Ens95 or (B) V4.2. The total number of clusters and cells that passed filtering are shown. Clusters of interest noted in the text are named. Cartilage and epidermis clusters are circled. (C, D). tSNE plots showing restricted expression of (C) mia in cartilate cells and (D) and1 in epidermis cells for both Ens95 and V4.2 annotations. Each cluster is indicated by a circle. Legends indicate log-transformed and normalized expression values. |

( |
( |
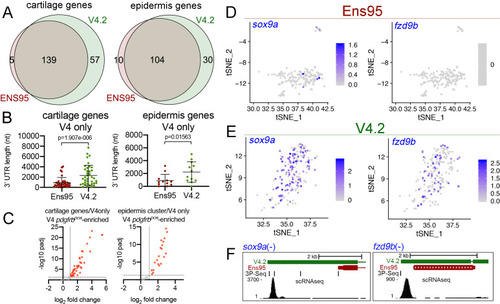
(A) Venn diagrams illustrating intersection by common LL gene ID of genes enriched in mia-positive cartilage cells and and1-positive epidermis cells by both indicated annotations. (B) 3' UTR lengths from Ens95 and V4.2 for reference genes identified as cartilage or epidermis-specific uniquely by V4.2. Data are not normally distributed (Shapiro-Wilks test), comparison by Wilcoxon matched-pairs signed-rank test, p-values are shown. (C) Volcano plots showing cartilage- or epidermis-specific genes identified selectively by V4.2 with corresponding values from bulk RNA-seq comparison of pdgfrbpos and pdgfrbneg cells. Red indicates log2 fold change >1 (pdgfrbpos/pdgfrbneg), padj <0.05. (D, E) tSNE plots of the mia-positive cartilage cluster showing expression levels of sox9a and fzd9b using scRNA-seq data quantified using (D) Ens95 and (E) V4.2. Legends indicate log-transformed and normalized expression levels per cell. (F) UCSC browser image of sox9a and fzd9b loci showing 3' UTR annotations from V4.2 and Ens95. Both loci are located on the negative strand. Mapped read depth from kdrlpos cells on the genome, or assigned to each annotation are indicated, as are 3P-seq features, all of which reside in the same orientation as the genes themselves. |

( |

(A) tSNE plot of all clusters from Ensembl (Ens95)-quantified scRNA-seq of zebrafish embryos at 5 days post fertilization with one erythroid and two leukocyte clusters indicated. (A–E, G) Circled clusters denote sla2pos leukocyte cells. Asterisk marks cells spuriously assigned to sla2pos leukocytes, but identified as erythroid two when using the V4.2 annotation. (B–E) tSNE plots showing only sla2pos leukocyte (circled) and erythroid clusters with expression of (B) known leukocyte markers, coro1a, and rac2, (C) erythroid marker hbae1.1, and (D) sla2. (E) tSNE plots showing expression of pcna and myb in sla2pos and erythrocyte clusters. (B–E) Legends indicate log-transformed and normalized expression values. (F) Erythroid and sla2pos (leukocyte) clusters identified using the same scRNA-seq dataset as in (A) but quantified using V4.2. A unique erythroid-like cluster (erythroid 2) is circled. (G) tSNE plot of erythroid and sla2pos leukocyte clusters identified with Ens95 quantified data. Dark green denotes cells with identical barcodes as those in the erythroid two cluster identified using V4.2 shown in (F). (H) Three-way Venn diagram intersecting cluster-specific genes of indicated clusters by gene symbol. Selected genes are shown. |
( |