
FIGURE
Figure 4
- ID
- ZDB-FIG-200916-10
- Publication
- Lawson et al., 2020 - An improved zebrafish transcriptome annotation for sensitive and comprehensive detection of cell type-specific genes
- Other Figures
-
- Figure 1
- Figure 1—figure supplement 1—source data 2.
- Figure 2—figure supplement 1.
- Figure 2—figure supplement 2.
- Figure 2.
- Figure 3
- Figure 3—figure supplement 1.
- Figure 3—figure supplement 2.
- Figure 3—figure supplement 3.
- Figure 4
- Figure 4—figure supplement 1.
- Figure 4—figure supplement 2.
- Figure 5
- Figure 5—figure supplement 1.
- Figure 6
- Figure 7.
- All Figure Page
- Back to All Figure Page
Figure 4
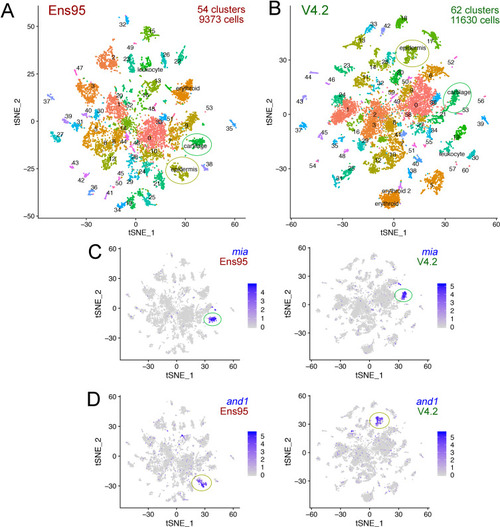
(A, B) tSNE plots of cells from 5 day post fertilization (dpf) zebrafish embryos from the same mapped scRNA-seq reads quantified with (A) Ens95 or (B) V4.2. The total number of clusters and cells that passed filtering are shown. Clusters of interest noted in the text are named. Cartilage and epidermis clusters are circled. (C, D). tSNE plots showing restricted expression of (C) mia in cartilate cells and (D) and1 in epidermis cells for both Ens95 and V4.2 annotations. Each cluster is indicated by a circle. Legends indicate log-transformed and normalized expression values. |
Expression Data
Expression Detail
Antibody Labeling
Phenotype Data
Phenotype Detail
Acknowledgments
This image is the copyrighted work of the attributed author or publisher, and
ZFIN has permission only to display this image to its users.
Additional permissions should be obtained from the applicable author or publisher of the image.
Full text @ Elife