
FIGURE
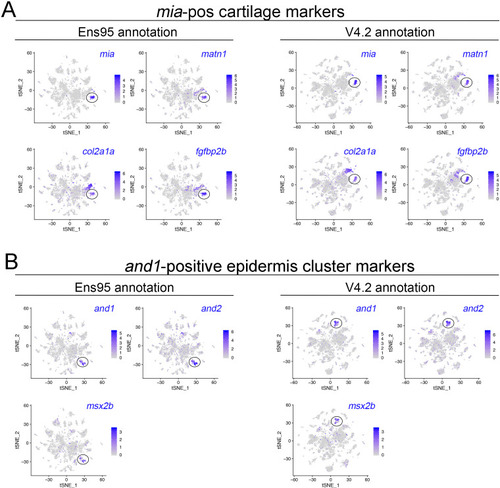
Figure 4—figure supplement 2.
- ID
- ZDB-FIG-200916-12
- Publication
- Lawson et al., 2020 - An improved zebrafish transcriptome annotation for sensitive and comprehensive detection of cell type-specific genes
- Other Figures
-
- Figure 1
- Figure 1—figure supplement 1—source data 2.
- Figure 2—figure supplement 1.
- Figure 2—figure supplement 2.
- Figure 2.
- Figure 3
- Figure 3—figure supplement 1.
- Figure 3—figure supplement 2.
- Figure 3—figure supplement 3.
- Figure 4
- Figure 4—figure supplement 1.
- Figure 4—figure supplement 2.
- Figure 5
- Figure 5—figure supplement 1.
- Figure 6
- Figure 7.
- All Figure Page
- Back to All Figure Page
Figure 4—figure supplement 2.
( |
Expression Data
Expression Detail
Antibody Labeling
Phenotype Data
Phenotype Detail
Acknowledgments
This image is the copyrighted work of the attributed author or publisher, and
ZFIN has permission only to display this image to its users.
Additional permissions should be obtained from the applicable author or publisher of the image.
Full text @ Elife