
|
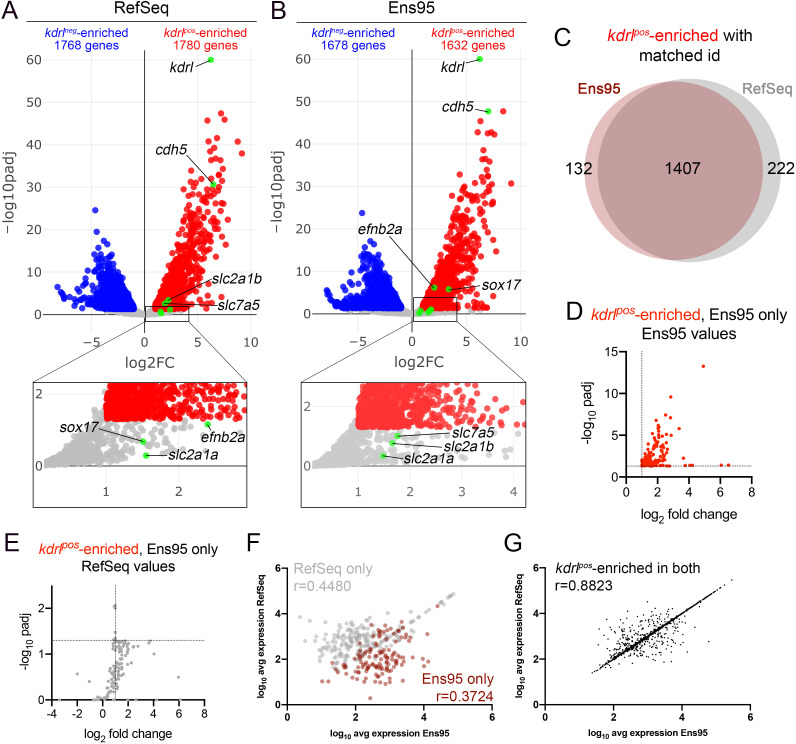
Figure 1 (A, B) Volcano plots showing differentially expressed genes from Tg(kdrl:HRAS-mCherry)s896-positive and negative (kdrlpos and kdrlneg) cells identified using RNA-seq reads quantified with (A) RefSeq or (B) Ensembl, version 95 (Ens95) transcript annotations. Genes with significant enrichment (padj <0.05) are shown as red or blue (log2 fold change >1 or <-1, respectively) across replicate samples (n = 3). Grey dots are genes that fall below statistical cutoffs. Green dots indicate selected genes previously found to be enriched in endothelial cells in zebrafish or other models. (C) Venn diagram illustrating the intersection of genes with a common NCBI ID in Ens95 and RefSeq found significantly enriched in kdrlpos cells using either annotation. (D, E) Plots of commonly annotated genes identified as kdrlpos-enriched only by Ens95 with indicated values from (D) Ens95 or (E) RefSeq. (F, G) Correlation of expression levels from indicated annotation for kdrlpos-enriched genes identified (F) selectively as such by Ens95 (maroon) or RefSeq (grey) only, or (G) both annotations. Data are not normally distributed, Spearman correlation, r values are indicated.