FIGURE SUMMARY
Title

The interplay of atoh1 genes in the lower rhombic lip during hindbrain morphogenesis

Authors
Belzunce, I., Belmonte-Mateos, C., Pujades, C.
Source
Full text @ PLoS One

Spatiotemporal analysis of <italic>atoh1a</italic> and <italic>atoh1b</italic> within the hindbrain.

A-E) Whole mount double in situ hybridization with atoh1a (green) and atoh1b (magenta) in wild type embryos from 14hpf to 42hpf. Dorsal views with anterior to the left. A’-E’) Reconstructed transverse views of dorsal views in (A-E) at the level indicated by the white arrow depicted in (A-E). Note that the expression of atoh1b is more lateral than atoh1a-cells. Dotted line corresponded to the neural tube contour. F-H) Whole mount double in situ hybridization with atoh1a (green) and atoh1b (magenta) on Tg[HuC:GFP] embryos from 24hpf to 42hpf, where HuC expression was displayed in white. Dotted line corresponded to the neural tube and the HuC-expression contours (only half of it). I-J) Embryos at 30hpf were double in situ hybridized with atoh1a (green) and atoh1b (magenta) and cell proliferation was assessed by anti-PH3 staining (white). Dorsal views with anterior to the left. I’-J’) Reconstructed transverse views of (I-J) at the level pointed by the white arrow in (I-J). Note atoh1a-cells underwent mitosis, whereas fewer atoh1b-cells did. Dotted line corresponded to the neural tube contour. K-K”) Tg[atoh1a:GFP] embryo after anti-PH3 (magenta) and DAPI (blue) staining. K’-K”) Reconstructed transverse views of the region framed in (K), which is a dorsal view with anterior to the left. This is an example of an apical atoh1a:GFP cell undergoing division (black asterisk) and lateral atoh1a:GFP cell that did not (white asterisk), with (K’) or without (K”) the red-PH3 staining. Note that atoh1a:GFP cell nuclei expressing PH3 are located in the apical region (black asterisks), whereas atoh1a:GFP cell nuclei negative for PH3 (most probably atoh1b-positive, white asterisk) are in the most lateral domain. L-L”) Tg[atoh1a:GFP] embryo incubated for 30min with BrdU (blue) and assayed for atoh1b in situ hybridization (magenta). Reconstructed transverse views with (L-L’) or without (L”) atoh1b-staining. White asterisks indicate atoh1b cells that did not incorporate BrdU. Dotted line corresponded to the neural tube contour. op, otic placode; ov, otic vesicle; r, rhombomere. Scale bars correspond to 50 μm.

Analysis of the <italic>atoh1a</italic> neuronal derivatives in Tg[atoh1a:GFP] embryos.

Tg[atoh1a:GFP] embryos at 24hpf and at 48hpf were assayed for atoh1a (A, G), atoh1b (B, H), lhx2b (C-D, I-J) in situ hybridization, and anti-HuC (E-F, K-L) staining. Dorsal views of confocal MIP from dorsal stacks (A-B) or ventral stacks (C-L) with anterior to the left. A’-L’) Reconstructed transverse sections of the dorsal views in (A-L) at the level indicated with the white arrow depicted in (A-L) corresponding to r4/r5. All embryos displayed the atoh1a-progenitors and derivatives in green. Note that atoh1b cells derive from atoh1a:GFP progenitors (B’, H’), as well as the lateral lhx2b neuronal domain (see white asterisks in C’, I-I’), whereas the medial lhx2b neuronal column in r4 is devoid of green staining (see white arrowhead in C, I-I’). See that differentiated neurons organize in arch-like structures (yellow arrowhead in G-L). ov, otic vesicle; SAG, statoacoustic ganglion; r, rhombomere. Scale bars correspond to 50 μm.

Cell lineages and behavior of <italic>atoh1a</italic>-derivatives.

Tg[atoh1a:H2A-mCherry] Tg[CAAX:GFP] embryos were imaged from 24hpf during 14h, and information about cell position was acquired every 7min. A) Dorsal view of an embryonic hindbrain displaying atoh1a cells in magenta with anterior to the left. The inserts display magnified stills from the framed area in (A) at different times (see white arrow as example of a cell that was tracked from t0 to t100). Note the cell nucleus displacement towards the apical side before division (t8). B-C) Cell lineages from r4 and r5 atoh1a-progenitors located at different dorsoventral levels within the atoh1a domain; n = 22 in (B) and n = 17 in (C). Each line corresponds to a single cell that branches upon division. Lines are colored according to cell differentiation status: progenitors in grey and differentiated cells in green. The X-axis corresponds to developmental time. The right-hand images display examples of the trajectories of the atoh1a tracked cells (white arrow) on the top of the transverse views at t0 (24hpf). Cell trajectories are color-coded according to cell differentiation status: progenitors are in white and differentiated cells in green. Cells are considered differentiated neurons when they are within the neuronal differentiation domain. Dorsal most atoh1a cells are encircled in orange and ventral atoh1a cells are encircled in white. D) Histogram displaying the number of most dorsal (orange) or ventral (white) atoh1a:GFP cells that undergo different number of divisions over time. Note that atoh1a-cells that are more dorsally located undergo less division rounds (orange bars) than the ones in a more ventral position (white bars). E) Mode of cell division according to the DV position of the atoh1a-progenitor cells. NN, progenitors giving rise to two neurons; NP, progenitors generating one neuron and one progenitor; PP, progenitor cells that give rise to two progenitors. Note that most dorsal atoh1a cells give rise to differentiated cells in all analyzed cases (n = 22 atoh1a progenitors), whereas atoh1a cells more ventrally located employ the three modes of division (n = 17 atoh1a progenitors). nt, lumen of the neural tube; ov, otic vesicle; r, rhombomere.

EXPRESSION / LABELING:
Genes:
Fish:
Anatomical Term:
Stage Range: Prim-5 to Prim-15

<italic>atoh1a</italic> is required for the specification of the <italic>lhx2b</italic> neuronal population.

A-L) atoh1aWT and atoh1afh282 embryos in the Tg[atoh1a:GFP] background were analyzed at 24hpf (atoh1aWT n = 14; atoh1afh282 n = 18) and 36hpf (atoh1aWT n = 11; atoh1afh282 n = 7) with atoh1b (A, D, G, J), lhx2b (B, E, H, K), and anti-GFP in order to follow the atoh1a-derivatives (C, F, I, L). A’-L’) Reconstructed transverse views of dorsal views displayed in (A-L) at the level of the anterior side of the otic vesicle. Note that atoh1b expression (compare A-A’ and G-G’ with D-D’ and J-J’), and the lateral domains of lhx2b diminished (compare white asterisks in B-B’ with E-E’, and H-H’ with K-K’), whereas the more medial domain does not decrease so dramatically (compare white arrowheads in B-B’ with E-E’, and H-H’ with K-K’). Note that atoh1a:GFP cells remained, suggesting that there is no massive cell death. M-N) Quantification of differentiated neurons in the r4/r5 and r5/r6 domains of atoh1aWT and atoh1afh282 embryos as depicted in the small inserts showing dorsal views of halves hindbrains that correspond to the framed regions in (F-L), *** p<0.001 (Table 1 for values and statistical analysis). Note the reduction in the number of atoh1a:GFP differentiated neurons in atoh1afh282 embryos. ov, otic vesicle; r, rhombomere. Scale bars correspond to 50 μm.

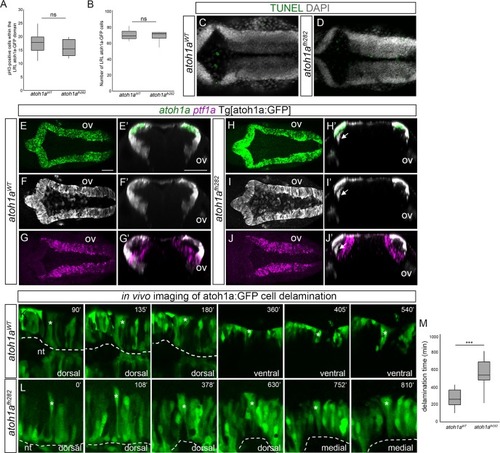
<italic>atoh1a</italic><sup><italic>fh282</italic></sup> mutation does not result in changing the cell fate or cell loss.

A-B) Box-plots with the quantification of mitotic figures within the LRL atoh1a:GFP cells (A), and the total number of LRL atoh1a:GFP cells (B), in atoh1aWT and atoh1afh282 embryos. C-D) atoh1aWT and atoh1afh282 embryos in the Tg[atoh1a:GFP] background were analyzed for apoptotic figures by TUNEL. Note that no differences between wild type and mutant embryos were observed (Table 2 for values and statistical analysis). E-G) atoh1aWT (n = 8) and (H-J) atoh1afh282 (n = 10) embryos in the Tg[atoh1a:GFP] background were concomitantly analyzed for atoh1a (E, H), atoh1a-derivatives visualized with anti-GFP staining (F, I) and ptf1a (G, J) expression. E’-J’) Reconstructed transverse views of dorsal views displayed in (E-J) at the level of the otic vesicle. Note that the atoh1a:GFP cells in the atoh1afh282 mutant did not migrate towards the differentiation domain and did not display ptf1a (see white arrow in H’-J’), indicating that progenitor cells did not switch fate. K-L) Time-lapse stills showing delamination from the LRL of tracked atoh1a:GFP cells (indicated with white asterisk) in atoh1aWT (n = 28) and atoh1afh282 (n = 12) embryos in the Tg[atoh1a:GFP] background. Dorsal views of hemi-neural tubes (dashed white line indicates the apical region of the hindbrain), with anterior to the left and lateral at the top. Numbers at the top-right indicate the minutes after the beginning of the movie. Note that in wild type embryos, the cell delaminates and migrates towards ventral, allocating in the corresponding neuronal differentiation zone (see the first three dorsal frames and then the following ventral ones), whereas in atoh1afh282 embryos the indicated cell remains within the dorsal epithelium (see that there are four dorsal and two medial frames because the cell never reaches ventral). M) Box-plot indicating the time of delamination from the LRL of atoh1a:GFP cells in atoh1aWT and atoh1afh282 embryos. Note that cells from wild type embryos exit the LRL much earlier than the cells from mutant siblings. Since the atoh1afh282 mutant allele only caused a deleterious phenotype in homozygosity, wild type and heterozygous conditions showed identical phenotypes and they were displayed as single wild type condition. nt; neural tube lumen; ov, otic vesicle. Scale bars correspond to 50 μm. ns, non-statistically significant; *** p<0.001.

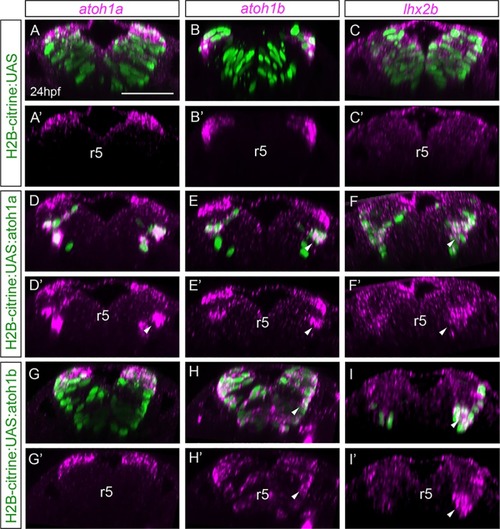
<italic>atoh1a</italic> is upstream of <italic>atoh1b</italic> and is necessary for <italic>lhxb2</italic> neurons.

Mu4127 embryos expressing Gal4 in rhombomeres 3 and 5 were injected with H2B-citrine:UAS (A-C), H2B-citrine:UAS:atoh1a (D-F) or H2B-citrine:UAS:atoh1b (G-I) constructs in order to ectopically express the gene of interest in r3 and r5. Injected embryos were assayed for Citrine expression (green) and atoh1a (A-A’, D-D’, G-G’), atoh1b (B-B’, E-E’, H-H’) or lhx2b (C-C’, F-F’, I-I’) expression (magenta). Reconstructed transverse views displaying the merge of the red and green channels (A-I), or only the red channel (A’-I’). Note that ectopic expression of atoh1a in more ventral domains induces atoh1b and lhxb2 expression (see white arrowheads in D-F, D’-F’), whereas ectopic atoh1b expression induces lhx2b but not atoh1a (see white arrowheads in H-I, H’-I’). See Table 3 for numbers of analyzed embryos. r, rhombomere. Scale bars correspond to 50 μm.

Notch-signaling regulates the transition of <italic>atoh1a</italic> cycling progenitors towards <italic>atoh1b</italic> committed cells.

A-B) Whole mount double in situ hybridization with atoh1a (green) and atoh1b (magenta) in Tg[tp1:GFP] embryos (readout of Notch-activity in white). A’-B’) Reconstructed transverse views of embryos displayed as dorsal views in (A-B) through the point indicated by the white arrow. Note that Notch-activity is restricted to the most dorsomedial tip of the hindbrain, corresponding with atoh1a cells. C-K) atoh1aWTTg[atoh1:GFP] (C-H) and atoh1afh282Tg[atoh1:GFP] (I-K) siblings were double in situ hybridized with atoh1a (green) and atoh1b (magenta) after treatment with DMSO (C-E, n = 10) or the gamma-secretase inhibitor LY411575 (F-H, n = 15; I-K n = 3). The atoh1a derivatives were followed by anti-GFP staining in white. C’-K’) Reconstructed transverse views of embryos displayed as dorsal views in (C-K) at the level indicated by the white arrow. Note how the atoh1b-domain expands at expense of atoh1a progenitors after blocking Notch-activity in wild type embryos, but not in atoh1afh282 mutants. A-D, F-G, I-J) Dorsal views of confocal MIP from dorsal stacks with anterior to the left. E, H, K) Dorsal views of confocal MIP from ventral hindbrain with anterior to the left. ov, otic vesicle. Scale bars correspond to 50 μm.

ZFIN is incorporating published figure images and captions as part of an ongoing project. Figures from some publications have not yet been curated, or are not available for display because of copyright restrictions.

EXPRESSION / LABELING:
Genes:
Fish:
Anatomical Terms:
Stage Range: 14-19 somites to Prim-5
Acknowledgments
This image is the copyrighted work of the attributed author or publisher, and ZFIN has permission only to display this image to its users. Additional permissions should be obtained from the applicable author or publisher of the image. Full text @ PLoS One