
- Title
-
Ishige okamurae Extract and Its Constituent Ishophloroglucin A Attenuated In Vitro and In Vivo High Glucose-Induced Angiogenesis
- Authors
- Fernando, K.H.N., Yang, H.W., Jiang, Y., Jeon, Y.J., Ryu, B.
- Source
- Full text @ Int. J. Mol. Sci.
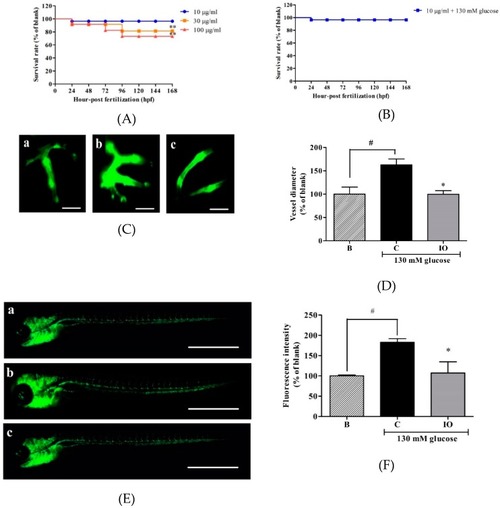
Effects of |
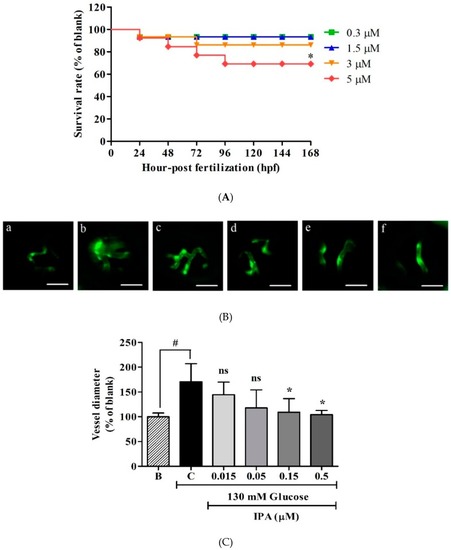
Effects of IPA on transgenic zebrafish ( |
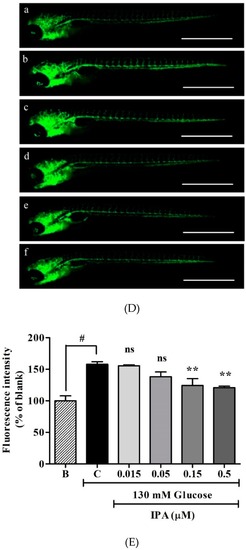
Effects of IPA on transgenic zebrafish ( |
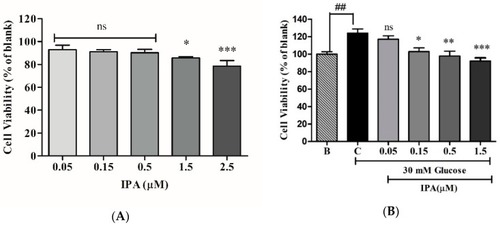
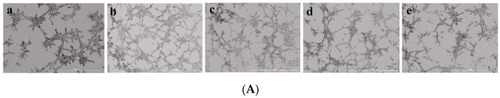
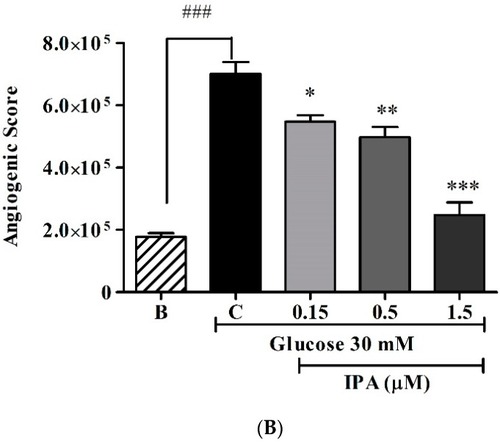
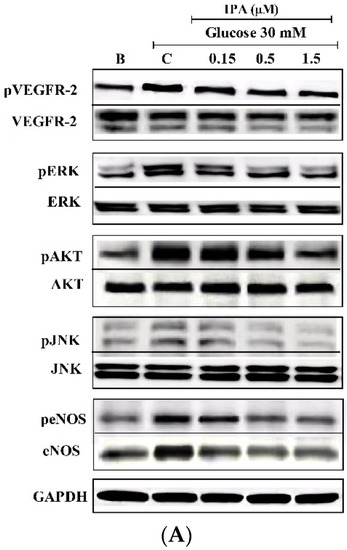
IPA inhibits the proliferation of EA.hy926 cells. ( |

( |
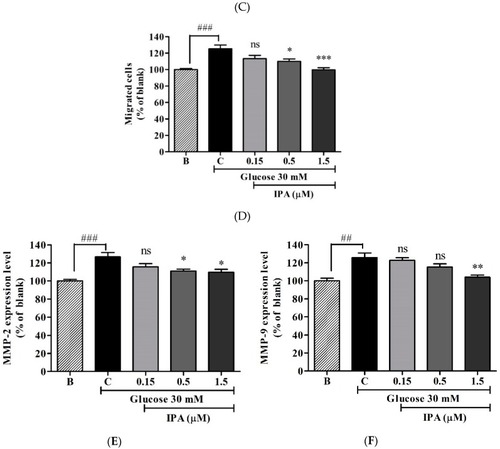
( |
( |
( |
( |

( |