IMAGE

Figure 2

ID
ZDB-IMAGE-191230-453
Source
Figures for Fernando et al., 2019
Image
Figure Caption

Figure 2

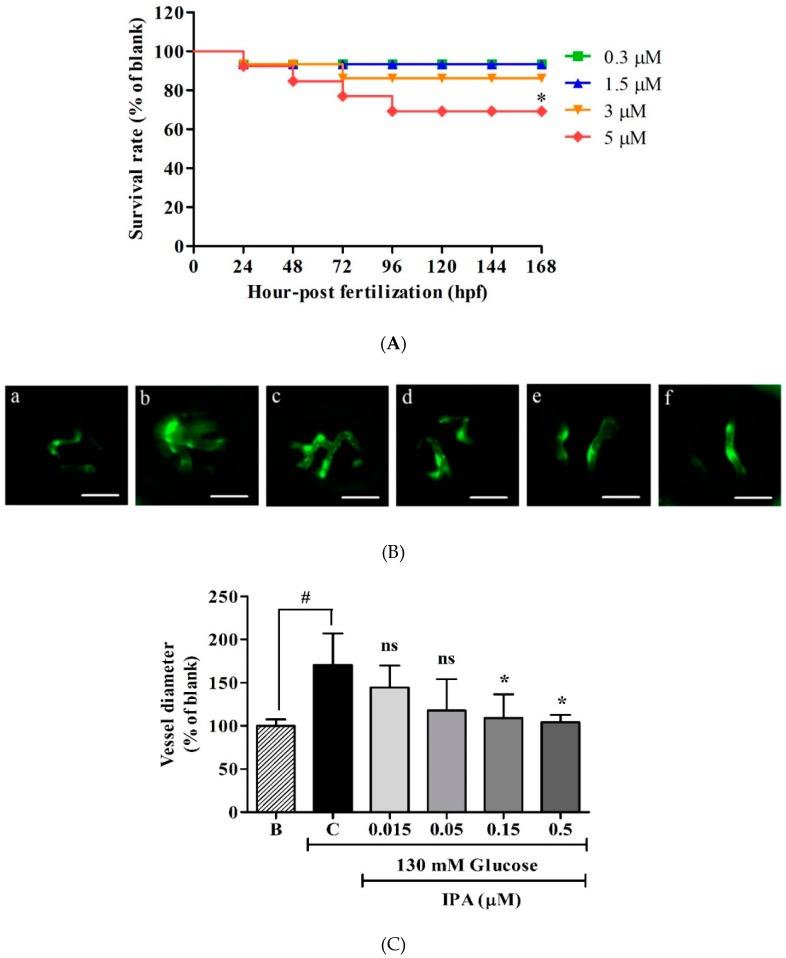
Effects of IPA on transgenic zebrafish (flk:EGFP) embryos. (A) Effects of IPA on the survival rate of transgenic zebrafish (flk:EGFP) embryos. The embryos were treated with 0.3, 1.5, 3, and 5 µM IPA for 24, 48, 72, 96, 120, 144, and 168 hpf. The treatment effects were normalized to blank (0 µM IPA). (B) Fluorescence microscopic images of the retinal vessels of transgenic zebrafish (flk:EGFP) embryos treated with IPA. (C) The diameter of hyaloid retinal vessels treated with IPA. (D) The images of whole body vessel formation in transgenic zebrafish (flk:EGFP) embryos treated with IPA as obtained by fluorescence microscopy. (E) Quantified fluorescence intensity of the whole body treated with IO extract (a: 0 mM glucose + 0 µM IPA, b: 130 mM glucose + 0 µM IPA, c: 130 mM glucose + 0.05 µM IPA, d: 130 mM glucose + 0.15 µM IPA, e: 130 mM glucose + 0.5 µM IPA, and f: 130 mM glucose + 1.5 µM IPA). The effects of 130 mM glucose on vessel formation were compared to B (blank (0 mM glucose + 0 µM IPA)). The effects of IPA on high glucose-induced vessel formation were normalized to C (control (130 mM glucose + 0 µM IPA)). Scale bar (B) 20 µm, (D) 1000 µm. ns; not significant, * p ˂ 0.05, ** p ˂ 0.01, #p ˂ 0.05.

Acknowledgments
This image is the copyrighted work of the attributed author or publisher, and ZFIN has permission only to display this image to its users. Additional permissions should be obtained from the applicable author or publisher of the image. Full text @ Int. J. Mol. Sci.