FIGURE SUMMARY
Title

Retrograde Ret signaling controls sensory pioneer axon outgrowth

Authors
Tuttle, A., Drerup, C.M., Marra, M., McGraw, H., Nechiporuk, A.V.
Source
Full text @ Elife

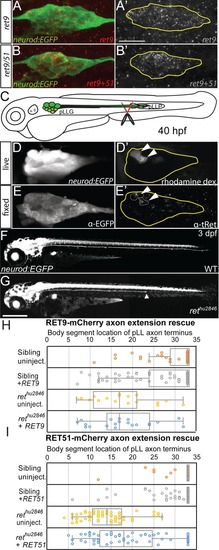
<italic>ret</italic> mRNA probe design and antibody validation.

(A) Schematic of ret genomic locus, spliced ret9 and ret51 isoforms, and anti-sense mRNA probe targets for fluorescence in situ hybridization in Figure 1ret9 in situ probe contains the unique portion of exon 19, specific to this isoform, and intron 19–20 sequence, whereas ret9+51 in situ probe encompasess exon 20 (contained within ret9 transcript 3’UTR) and 3’UTR common to both isoforms. (B,C) Whole-mount immunolabeling for total Ret protein of wild-type sibling (B) and rethu2846 mutant (C) with anti-tRet antibody at 48 hpf. neurod:EGFP transgene marks all neurons in the pLL ganglion (outlined). tRet immunoreactivity (arrowheads) is present a subset of wild-type neurons but is completely absent from the rethu2846 mutant. N = 8 wild-type sibs and N = 6 mutants from two independent experiments. (D,E) Whole-mount immunolabeling of wild-type siblings with anti-phospho-Ret (p905) antibody. neurod:egfp-positive embryos were injected with 5 pg of neurod5kb:RET51-mCherry fusion plasmid and fixed at 25 hpf. Anti-pRet antibody recognizes overexpressed RET51-mCherry fusion protein. Panels show immunolabeling of pLL ganglion (D) and pioneer growth cones (E) in wild-type embryo with pRet antibody. Note absence of the signal in the ganglion or cell bodies of neurons that express Ret51-mCherry (yellow arrowheads). However, pRet signal was reliably detected in growth cones (white arrowheads). N = 12 cells from two independent experiments.

ZFIN is incorporating published figure images and captions as part of an ongoing project. Figures from some publications have not yet been curated, or are not available for display because of copyright restrictions.

Ret loss-of-function alters pioneer axon growth cone morphology and protrusion.

(A,B) Lateral view, live image of collective pioneer axon terminals of wild-type siblings (A) and rethu2846 mutants (B) labeled by neurod:EGFP transgene at 30 hpf. (A’,B’) Individual pioneer axons labeled by mosaic expression of neurod5kb:mCherry plasmid (Arrowheads = examples of counted filopodia). (C,D) Quantification of distal collective axon terminal volume (C) or individual pioneer growth cone volume (D). rethu2846 mutants have significantly reduced collective axonal and individual growth cone volume. (E,F) Quantification of number (E) and length (F, n = filopodia counted) of filopodia (≥1 μm) per individual pioneer axon. Note that rethu2846 mutants have significantly reduced number of filopodia but not length. Error bars represent S.E.M.,**=p < 0.01, ***=p < 0.001, N.S. = not significant.

10.7554/eLife.46092.007

Individual embryo scoring data for scoring of growth cone and filopodia metrics in <italic>ret</italic> mutants.

These data can be opened with Microsoft Excel or with open-source alternatives such as OpenOffice.

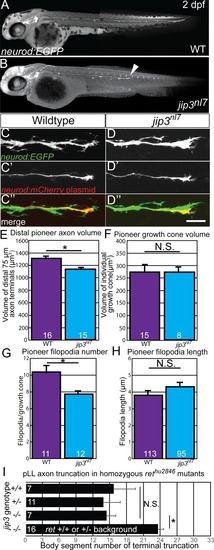
Quantification of <italic>jip3<sup>nl7</sup></italic> homozygous mutant axon truncation defects.

Whisker plot of body segment location of axon termination at 72 hpf. Siblings (n = 43) display no truncation compared to significant truncation in jip3 mutants (n = 39).

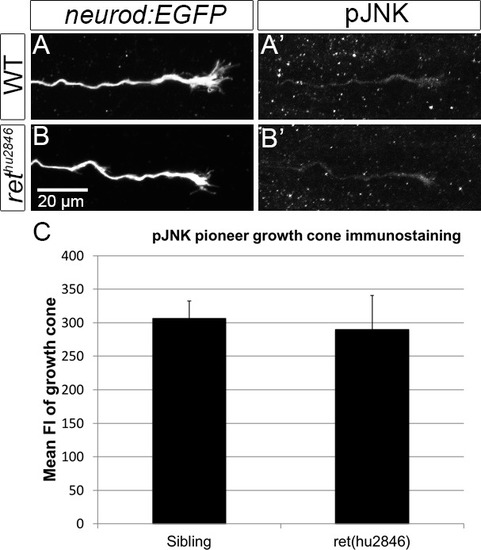
Anti-pJNK antibody immunostaining of pioneer growth cones.

(A,B) Immunostaining for phosphorylated JNK in pioneer axons in wild type (A) and rethu2846 mutants (B) at 30 hpf. pJNK signal in extending pioneer growth cones looks similar between siblings (A’) and mutants (B’). (C) Mean fluorescence intensity measured for the most distal pLLG growth cones (visualized by neurod:EGFP transgene) was compared between sibling (306 ± 26, n = 14) and rethu2846 mutants (290 ± 51, n = 6) at 30 hpf, as not significantly different (p=0.78 by Mann-Whitney U test). Error bars represent S.E.M.

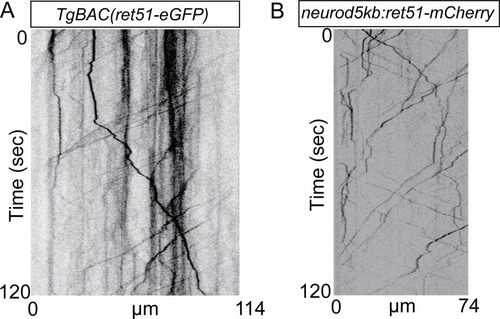
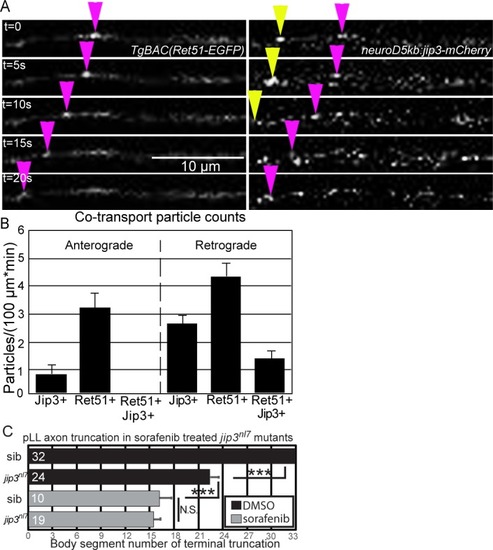
In vivo imaging of Ret51 trafficking.

(A) Kymographs generated from the pLLG pioneer axons of embryos injected with BAC expressing GFP-tagged zebrafish Ret51. (B) Kymograph generated from the pLLG axons of embryos injected with plasmid expressing mCherry-tagged RET51. Discrete tagged particles of Ret51 are trafficked in both cases anterogradely and retrogradely.

Sorafenib induces pLLG axon truncation similar to that found in Ret genetic loss-of-function at 72 hpf.

Treatment with 5 μM sorafenib from 24 to 72 hpf induced axon truncations in wild-type siblings (0.50 ± 0.06; n = 44) not significantly different than untreated ret homozygous mutants (0.53 ± 0.03; n = 17; p=0.95 by one way ANOVA with post-hoc Tukey test) or sorafenib-treated ret homozygous mutants (0.50 ± 0.05; n = 16; p=0.92). Error bars represent S.E.M., N.S. = Not significant.

ZFIN is incorporating published figure images and captions as part of an ongoing project. Figures from some publications have not yet been curated, or are not available for display because of copyright restrictions.

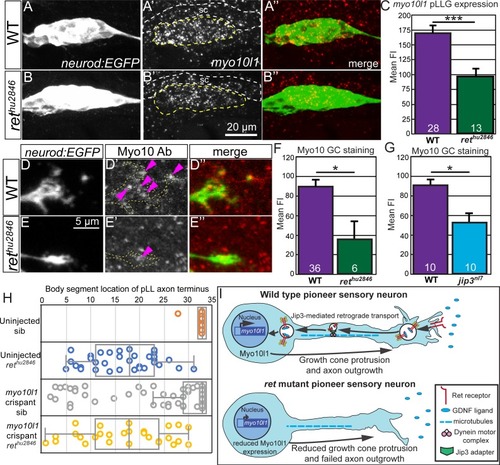
Assessment of anti-Myo10 antibody and <italic>myo10l1</italic> gRNA efficiency.

(A) Myo10 antibody staining for neurons in embryos injected with myo10l1-eGFP BAC. Rohon-Beard neurons expressing Myo10l1-eGFP (A) are also positive for Myo10 antibody staining (A’). (B) Scale diagram of zebrafish Myo10l1 protein. gRNAs target distinct sites in myo10l1 exons corresponding to specific regions of the protein (red arrowheads). PH = Pleckstrin homology domain, MyTH = Myosin tail homology four domain, FERM = 4.1 protein, Ezrin, Radixin, Moesin domain. (C) Amplification of targeted CRISPR cut target regions containing restriction cut sites. Gel electrophoresis (2% agarose gel) of PCR amplification of each CRISPR cut site from genomic DNA of individual four dpf larvae injected with gRNA triplex cocktail that display significant pLLG truncation or uninjected embryos. Following PCR, amplicons are incubated with restriction enzymes that cut near CRISPR target sites. Uninjected embryos have near complete digest of amplicons at each CRISPR target site, but triplex-injected crispants that display pLLG truncation show substantial amounts of resistance to digest. *=1 kb plus ladder.

Acknowledgments
This image is the copyrighted work of the attributed author or publisher, and ZFIN has permission only to display this image to its users. Additional permissions should be obtained from the applicable author or publisher of the image. Full text @ Elife