
- Title
-
tmem33 is essential for VEGF-mediated endothelial calcium oscillations and angiogenesis
- Authors
- Savage, A.M., Kurusamy, S., Chen, Y., Jiang, Z., Chhabria, K., MacDonald, R.B., Kim, H.R., Wilson, H.L., van Eeden, F.J.M., Armesilla, A.L., Chico, T.J.A., Wilkinson, R.N.
- Source
- Full text @ Nat. Commun.

tmem33 knockdown inhibits angiogenesis and localises to the ER in ECs. a–dtmem33 is expressed ubiquitously during segmentation, but displays enrichment in the pronephros (black arrowheads) and somite boundaries, which is more pronounced from 24 hpf. Pronephric expression is evident in 26 hpf transverse sections (black arrows). e–g Tmem33-EGFP protein localises to the nuclear envelope (blue arrowheads) and ER (white arrowheads) within the caudal artery in fli1a:DsRedEx2embryos (Scale bars 1 µm). h–k tmem33 morphants injected with 0.4 ng morpholinos display delayed migration of Tg(fli1a:egfp) positive SeAs, which stall at the horizontal myoseptum (j, k, white arrowheads), compared with control Tg(fli1a:egfp) positive morphants (h, i), which begin to anastomose by 30 hpf (yellow arrowheads) (scale bars 50 µm). l–o By 48 hpf, Tg(fli1a:EGFP;−0.8flt1:RFP) tmem33 morphant SeAs complete dorsal migration, but display incomplete DLAV formation (n, o, yellow arrowheads) and lack lymphatic vasculature (red arrowheads). At 48 hpf Tg(fli1a:EGFP; −0.8flt1:RFP) control morphants display secondary angiogenesis (l, m, yellow arrowheads) and parachordal lymphangioblasts (red arrowhead) (scale bars 50 µm). p tmem33 morphants injected with 0.4 ng morpholinos display reduced SeA length at 30 hpf (t-test ****p = < 0.0001; t = 4.075; DF = 24. n = 3 repeats, 10 embryos per group). q tmem33 morphants injected with 0.4 ng morpholinos display incomplete formation of DLAV (t-test ****p = < 0.0001; t = 5.618; DF = 28. n = 3 repeats, 9 or 10 embryos per group). r, s Thoracic duct formation is impaired in tmem33 morphants injected with 0.4 ng morpholinos (white asterisks), compared with control morphants (white arrowheads) (scale bars 50 µm). DA, dorsal aorta; PCV, posterior cardinal vein. Source data are provided as a Source Data file EXPRESSION / LABELING:
PHENOTYPE:
|

tmem33 knockdown reduces Ca2+ oscillations in tip cells and reduces EC filopodia. a–d tmem33 morphants injected with 0.4 ng morpholinos display reduced endothelial Ca2+ oscillations. Intensity projections show Ca2+ oscillations in both control and tmem33 morphants, highlighting intensity over duration of the time lapse. Change in fluorescence over 300 s for four SeAs, trace colours correspond to equivalent arrowheads (scale bars 50 µm). e tmem33 morphants display a significant reduction in Ca2+ oscillations when compared with control morphants (unpaired t-test ****p = < 0.001; t = 5.633; DF = 10, 2 repeats, n = 3 embryos per group). f, g tmem33 morphants injected with 0.4 ng morpholinos display delayed migration of SeAs, which extend fewer filopodia, compared with controls (black arrowheads) (scale bars 5 µm). h tmem33 morphants display significantly fewer filopodia per SeA compared with controls. Measurements taken from n = 4 SeAs per embryo. Unpaired t-test, ****p = < 0.0001; t = 7.805; DF = 24, 2 repeats, n = 6 or 7 embryos per group). i tmem33 morphants display reduced filopodia length compared with controls, measurements taken from n = 4 SeAs. Unpaired t-test ****p < 0.0001; t = 10.86; DF = 24; 2 repeats, n = 6 or 7 embryos per group. Source data are provided as a Source Data file
EXPRESSION / LABELING:
PHENOTYPE:
|

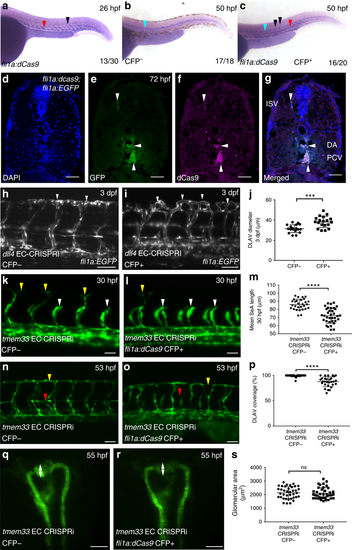
Injection of sgRNAs targeting tmem33 into stable Tg(fli1a:dCas9;cryaa:CFP)sh512 embryos recapitulates knockdown of tmem33. a dCas9 is expressed within the developing vasculature (red arrowhead) including SeAs (black arrowheads) in ~50% of progeny from a Tg(fli1a:dCas9;cryaa:Cerulean)sh512/ + outcross at 26 hpf. At this stage the dominant cryaa:Ceruleanmarker is not expressed. b dCas9 is not expressed within the developing vasculature in CFP-Tg(fli1a:dCas9;cryaa:Cerulean)sh512 transgenic embryos at 50 hpf. Probe trapping in notochord is highlighted (blue arrowhead). c dCas9 is expressed within the dorsal aorta (red arrowhead) and SeAs (black arrowheads) in CFP+Tg(fli1a:dCas9;cryaa:Cerulean)sh512 transgenic embryos at 50 hpf. Probe trapping in notochord is highlighted (blue arrowhead). d–g Colocalisation of dCas9 and GFP in 72 hpf fli1a:dCas9; fli1a:EGFP embryo indicates EC restricted expression of dCas9 (white arrowheads) Scale bars 20 μm. h, i Tg(fli1a:dCas9;cryaa:Cerulean) embryos injected with sgRNA targeting dll4 phenocopies ectopic vascular looping within the DLAV previously observed in dll4 morphants and mutants at 3 dpf (white arrowheads). j Tg(fli1a:dCas9;cryaa:Cerulean)-positive embryos injected with sgRNAs targeting dll4 display increased DLAV diameter (unpaired t-test ***p = < 0.001; t = 4.203 DF = 35; 2 repeats; n = 9 embryos per group). Scale bars 50 µm. k-mTg(fli1a:dCas9;cryaa:Cerulean) embryos injected with sgRNAs targeting tmem33 display reduced SeA length (yellow arrowheads highlight normal SeAs, white arrowheads highlight delayed SeAs) at 30 hpf (unpaired t-test ***p = < 0.0001; t = 6.716 DF = 62; 3 repeats; n = 9–12 embryos per group). Scale bars 50 µm. n–p Tg(fli1a:dCas9;cryaa:Cerulean) embryos injected with sgRNAs targeting tmem33 display absent parachordal lymphangioblasts (red arrowhead) and reduced DLAV continuity (yellow arrowheads) (unpaired t-test ***p = < 0.0001; t = 6.399 DF = 56; 3 repeats; n = 9–11 embryos per group). Scale bars 50 µm. q–s Tg(fli1a:dCas9;cryaa:Cerulean) embryos injected with sgRNAs targeting tmem33 display no significant difference in glomerular area, compared with Tg(fli1a:dCas9;cryaa:Cerulean)-negative siblings embryos (unpaired t-test, ns = not significant; t = 0.4048; DF = 74; 3 repeats; n = 12–13 embryos per group). Scale bars 200 µm. Source data are provided as a Source Data file
EXPRESSION / LABELING:
PHENOTYPE:
|
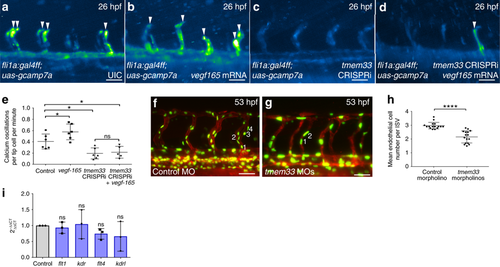
tmem33 functions downstream of Vegfa during angiogenesis. a–e tmem33 knockdown prevents Vegfa-mediated increases in Ca2+ oscillations. Overexpression of vegfa165 significantly increases frequency of Ca2+ oscillations in SeAs, whereas tmem33knockdown alone and in the presence of vegfa165 significantly reduce frequency of Ca2+ oscillations in SeAs. Intensity projection over time showing Ca2+ oscillations highlighting intensity change over duration of time lapse. Embryos display changes in fluorescence in SeA tip cells (white arrowheads) (two-way ANOVA with Holm–Sidak’s corrections: *p = < 0.05. 2 Repeats, n = 3 embryos per group) (scale bars 50 µm). f–h tmem33 knockdown using 0.4 ng morpholinos reduces EC number in ISVs at 53 hpf. h Unpaired t-test; ****p < 0.0001; t = 6.507; df = 30; 2 repeats; n = 8 embryos per group. i VEGF receptor expression is not significantly affected in tmem33 crispants (one-way ANOVA with Dunnett’s corrections; p = < 0.05, n = 3 repeats). Source data are provided as a Source Data file
|
tmem33 knockdown reduces endothelial Notch and ERK signalling during angiogenesis. a–c Notch reporter expression is unaffected by injection of 0.4 ng tmem33 morpholinos at 26 hpf. Notch signalling activity in control embryos is present in neural tube (blue arrowhead) and DA (red arrowhead) (c, unpaired t-test; t = 0.5553; DF = 20; 2 repeats; n = 5 or 6 embryos per group). Scale bars 50 µm. d–f Injection of 0.4 ng tmem33 morpholinos reduces Notch reporter expression at 48 hpf. Notch expression in control Tg(csl:venus) embryos is present in the neural tube (blue arrowhead), DA (red arrowhead) and SeAs (white arrowheads) (f, unpaired t-test; p = 0.0451; t = 2.138; DF = 20; 2 repeats; n = 6 and 4 embryos per group). Scale bars 50 µm. g Expression of notch1b, dll4, hey2 and her12 are not significantly altered by tmem33 CRISPRi at 26 hpf (one-way ANOVA using post hoc Tukey’s comparison test. n = 3 repeats). h Expression of notch1b, dll4, hey2 and her12 are significantly reduced at 48 hpf by tmem33 CRISPRi (one-way ANOVA using post hoc Tukey’s comparison test. *p = < 0.05; **p = < 0.01. n = 3 repeats). i–p In comparison with control morphants (i–l), embryos injected with 0.4 ng tmem33 morpholino (m–p) display reduced expression of notch1b within the DA (i, m, red arrowheads) and SeAs (i, m, white arrowheads), dll4 within SeAs (j, n, white arrowheads), hey2 within the DA (k, o, red arrowheads) and her12 within the DA (l, p, red arrowheads) and SeAs (l, p, white arrowheads). Scale bars 100 µm. q–t tmem33 knockdown by CRISPRi reduces endothelial ERK phosphorylation (q, r, SeAs highlighted by yellow outline and white arrowheads). Intensity plot of ERK staining is shown (s, t, SeAs highlighted by yellow outline and white arrowheads). Scale bars 50 µm. u tmem33 crispants display significantly reduced levels of pERK phosphorylation. Pixel intensity normalised to neural tube ERK fluorescence (unpaired t-test, **p = 0.0097, t = 2.993 DF = 14. n = 2 repeats, 4 embryos per group). Source data are provided as a Source Data file
|

SOCE inhibition limits sprouting angiogenesis and disrupts signalling pathways downstream of VEGF. a, b SKF9635 impairs angiogenesis in Tg(fli1a:EGFP) embryos (white arrowheads) and induces abnormal tip cell morphology (blue arrowhead) by 27 hpf. Scale bars 50 µm. c SKF-96365-treated embryos display reduced SeA length by 27 hpf (unpaired t-test; p = < 0.0001; t = 11.22 DF = 14; 2 repeats, n = 4 embryos per group). d, e SKF-96365 treatment impairs DLAV formation (white asterisks) in comparison with control embryos, which form the DLAV normally by 50 hpf (white arrowheads). Abnormal tip cell morphology (blue arrowhead) remain in SKF-96365-treated embryos by 50 hpf. Scale bars 50 µm. f SKF-96365-treated embryos display increased frequency of abnormal vascular branching (stunted SeAs or incomplete DLAV anastomosis) by 50 hpf (unpaired t-test; p = < 0.0001; t = 14.28 DF = 18. n = 2 repeats, n = 5 embryos per group). g tmem33 expression is not significantly altered by SKF-96365 treatment (unpaired t-test; t = 0.911, DF = 4, n = 3 repeats). h–j SKF-96365 reduces frequency of endothelial Ca2+ oscillations in Tg(fli1a:gal4FFubs3;uas-gcamp7a) embryos. Intensity projection over time showing calcium oscillations in control embryos, highlighting intensity change over duration of time lapse (unpaired t-test; p = < 0.05; t = 2.594, DF = 10, n = 2 repeats, 3 embryos per group). k, l Notch reporter expression is reduced in SeAs (white arrowheads) and DA (red arrowhead) of Tg(csl:venus) embryos. Scale bars 50 µm. m DA expression of Notch reporter is reduced by SKF treatment (unpaired t-test, **p = 0.0097, t = 3.982 DF = 15, 2 repeats, n = 4 embryos per group). n, o SKF-96365 treatment reduces endothelial filopodia number (black arrowheads) and abnormal spade-shaped tip cell morphology (blue arrowhead), in Tg(fli1a:lifeact-mClover) embryos. Scale bars 5 µm. p SKF-96365 treatment reduces mean filopodia number per SeA per embryo by 26 hpf (unpaired t-test; p = < 0.05; t = 2.525, DF = 10, n = 2 repeats, n = 5 embryos per group). Source data are provided as a Source Data file
PHENOTYPE:
|