
Fig. 2
- ID
- ZDB-IMAGE-190624-32
- Genes
- Publication
- Savage et al., 2019 - tmem33 is essential for VEGF-mediated endothelial calcium oscillations and angiogenesis
- All Figures
- Figures for Savage et al., 2019
|
Fig. 2
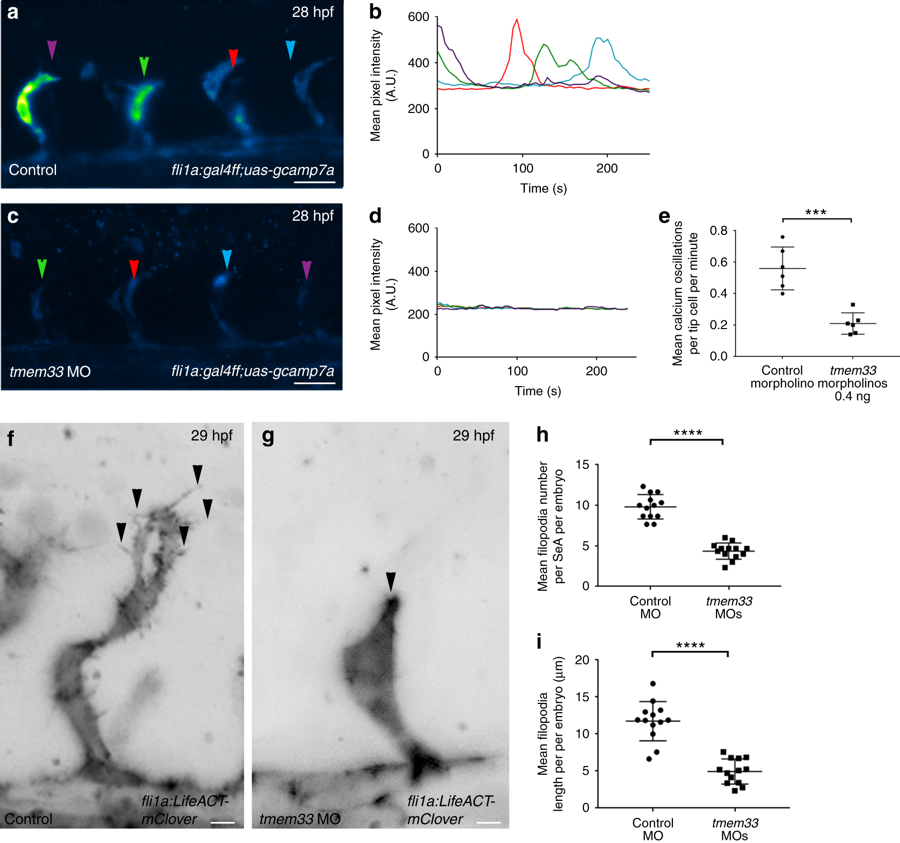
tmem33 knockdown reduces Ca2+ oscillations in tip cells and reduces EC filopodia. a–d tmem33 morphants injected with 0.4 ng morpholinos display reduced endothelial Ca2+ oscillations. Intensity projections show Ca2+ oscillations in both control and tmem33 morphants, highlighting intensity over duration of the time lapse. Change in fluorescence over 300 s for four SeAs, trace colours correspond to equivalent arrowheads (scale bars 50 µm). e tmem33 morphants display a significant reduction in Ca2+ oscillations when compared with control morphants (unpaired t-test ****p = < 0.001; t = 5.633; DF = 10, 2 repeats, n = 3 embryos per group). f, g tmem33 morphants injected with 0.4 ng morpholinos display delayed migration of SeAs, which extend fewer filopodia, compared with controls (black arrowheads) (scale bars 5 µm). h tmem33 morphants display significantly fewer filopodia per SeA compared with controls. Measurements taken from n = 4 SeAs per embryo. Unpaired t-test, ****p = < 0.0001; t = 7.805; DF = 24, 2 repeats, n = 6 or 7 embryos per group). i tmem33 morphants display reduced filopodia length compared with controls, measurements taken from n = 4 SeAs. Unpaired t-test ****p < 0.0001; t = 10.86; DF = 24; 2 repeats, n = 6 or 7 embryos per group. Source data are provided as a Source Data file