
- Title
-
Bleb Expansion in Migrating Cells Depends on Supply of Membrane from Cell Surface Invaginations
- Authors
- Goudarzi, M., Tarbashevich, K., Mildner, K., Begemann, I., Garcia, J., Paksa, A., Reichman-Fried, M., Mahabaleshwar, H., Blaser, H., Hartwig, J., Zeuschner, D., Galic, M., Bagnat, M., Betz, T., Raz, E.
- Source
- Full text @ Dev. Cell
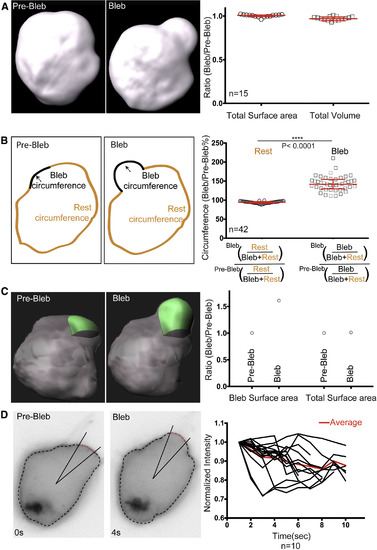
Cell Shape and Membrane Characteristics during Bleb Inflation In Vivo (A) 3D reconstruction showing a PGC before and after bleb inflation. The graph on the right shows the ratio of the cell surface area and the volume comparing bleb with the pre-bleb time points. (B) Schematic view of a PGC circumference prior to and following bleb formation, with black and orange colors representing the measured areas. The graph shows the ratio between the circumference of cells excluding the bleb area before and after bleb expansion (normalized to the whole-cell circumference) and the same ratio for the bleb area (median = 94.1% and 141.8% for “Rest” and “Bleb,” respectively). The circumference of the bleb prior to inflation was defined as the membrane length of the bleb neck at the pre-bleb time point. (C) 3D surface reconstruction for bleb (green) and the whole cell (gray) prior and after bleb expansion. The graph on the right shows the change in surface area of the bleb and the whole cell, before (Pre-Bleb) and after (Bleb) bleb expansion. (D) A PGC expressing farnesylated EGFP protein prior to and following bleb inflation. The cell outline was calculated using the Radial analysis program (see STAR Methods) and the bleb was defined by the change in the velocity of the plasma membrane. The central half of the bleb region (red dashed line) was monitored over time and the fluorescence intensities were plotted (right). The average intensity obtained from 10 measurements is presented in red. The graphs in (A) and (B) show median and interquartile range for data obtained in three independent experiments. The p value (∗∗∗∗p < 0.0001) was calculated using a non-parametric Mann-Whitney U test. n represents the number of blebs analyzed. In all of the panels the PGC membrane was labeled with farnesylated EGFP. See also Figure S6. |
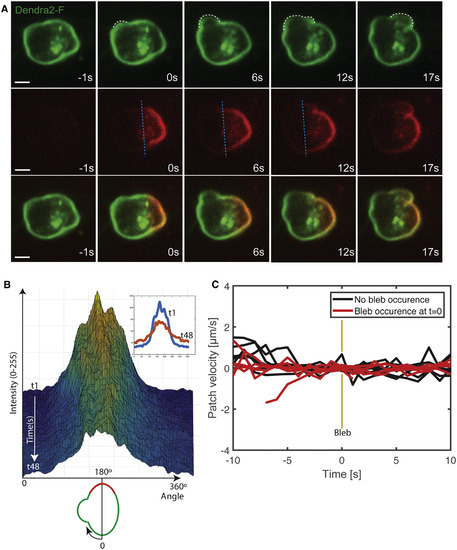
Lack of Membrane Flow in the Direction of the Forming Bleb in PGCs Migrating within Live Embryos (A) Farnesylated-Dendra2 (Dendra2-F) expressed on the plasma membrane of PGCs from 7 to 8 hr post fertilization (hpf) embryos was photoconverted (green to red) at the border of a forming bleb (white dashed line shows the contours of two sequential blebs, with the blue dashed line marking the edge of the converted area up to the 12 s time point). Cells were imaged at a frequency of one time point per second and the photoconversion time point is presented as zero (0 s). No directional flow with respect to the forming bleb is observed. Seven events of photoconversion next to a forming bleb were analyzed. Scale bar, 5 μm. (B) 3D surface plot of the converted area showing the intensity change along the circumference (0°–60°) of the cell presented in (A) over 48 s, but no change in the position of the center of the converted area. The inset shows the circumferential intensity in the first (1 s) and the last frame after photoconversion (48 s). A schematic of the cell analyzed is presented below the x axis. (C) Graph showing the velocity of the center of the photoconverted region in cells where blebs did not form (n = 5, black) and in cells in which bleb inflation occurred next to the photoconverted area (n = 7, red). t = 0 is the time of bleb formation. See also Figure S1. |
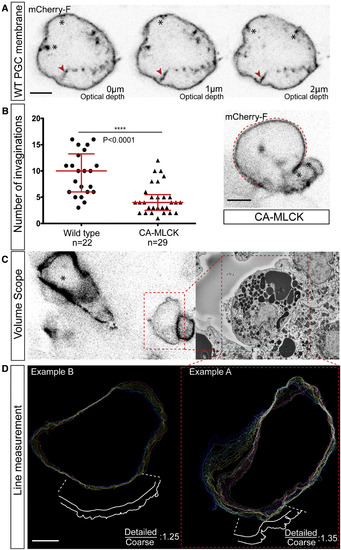
Detailed Analysis of PGCs within the Tissue Reveals Membrane Invaginations (A) Three confocal planes of a PGC plasma membrane labeled with farnesylated mCherry providing a z axis view of invaginations extending into the cell interior. One such invagination is highlighted with a red arrowhead at each of the three planes. Note that in the first plane, the connection of the structure to the membrane is not clearly seen, such that it resembles a vesicle. Additional invaginations connected to the plasma membrane are marked with black asterisks. (B) The graph shows the number of membrane invaginations in wild-type PGCs and in PGCs with elevated contractility (CA-MLCK), with an example for a manipulated cell presented on the right (n = 22 and n = 29 cells from 6 to 19 embryos, respectively; the graph shows the combined data from two independent experiments). The red dashed line highlights the contour of a large traveling bleb with black asterisks marking membrane invaginations within the cell body (see also Movie S4D). The p value (∗∗∗∗p < 0.0001) is calculated using a non-parametric Mann-Whitney U test. (C) Localization of PGCs for the correlative EM analysis, employing an arrowhead-shaped laser mark (asterisk). The dashed area labels one of the PGCs studied in the Teneo VolumeScope (right panel). (D) The Teneo VolumeScope data was used to measure the extent of extra plasma membrane stored in invaginations and wrinkles in PGCs (excluding long membrane tubes that span multiple planes). Every 200 nm the circumference of the cell was outlined, either by following the invaginations and wrinkles precisely or by crude tracing of the cell circumference (see example in the magnified region at the bottom). The ratio between the circumference lengths obtained using the detailed Teneo VolumeScope data and the coarse estimate for two cells is presented (29 and 15 sections were used for example A and B, respectively). Scale bars, 5 μm. See also Figure S2. |
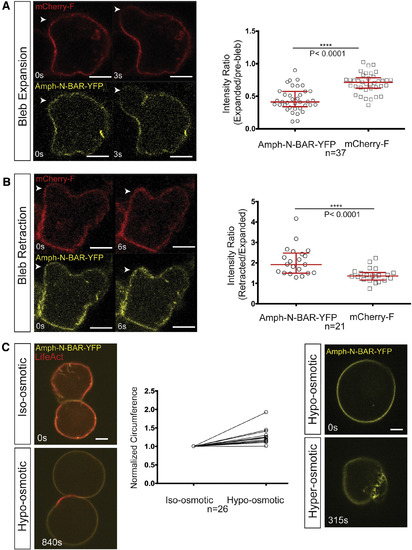
Analysis of Plasma Membrane Invaginations Unfolding and Folding during Bleb Inflation and Retraction (A) The YFP-labeled N-BAR domain of amphiphysin interacts with the plasma membrane and marks membrane structures protruding into the cytoplasm, and the mCherry-F protein labels the PGC's plasma membrane. White arrowheads point to the position of bleb expansion. The graph on the right shows that the signal intensity of the BAR domain (Amph-N-BAR-YFP) on the plasma membrane is reduced upon bleb expansion, with a smaller reduction observed using the farnesylated mCherry (mCherry-F) probe (median = 0.41 and 0.71 for the N-BAR probe and the mCherry-F, respectively; n = 37 cells from 21 embryos). (B) A similar analysis to that in (A) was conducted during bleb retraction. White arrowheads point to the position of bleb retraction. The graphs present the intensity ratio of each of the two probes, Amph-N-BAR-YFP and mCherry-F, between the retracted bleb and the expanded bleb (median = 1.91 and 1.35 for the N-BAR probe and the mCherry-F, respectively; n = 21 cells from 15 embryos). (C) Two PGCs in deyolked embryos expressing N-BAR domain of amphiphysin and lifeAct in iso-osmotic (left, upper panel) and later in hypo-osmotic conditions (left, lower panel). The graph shows the change in the circumference of the cells in a confocal section after the exposure to hypo-osmotic medium. The values are normalized to the circumference in the iso-osmotic solution (n = 26 cells). Right panels show a PGC expressing N-BAR domain of amphiphysin (Amph-N-BAR-YFP) subjected to a change from hypo-osmotic to hyper-osmotic conditions (right upper and lower panels, respectively). All graphs show median and interquartile range. The p value (∗∗∗∗p < 0.0001) was calculated using a non-parametric Mann-Whitney U test. Scale bars, 5 μm. See also Figures S3 and S4. |

Membrane invaginations in PGCs migrating within live embryos require Cdc42 for formation and colocalize with polymerized actin structures (A) Lack of co-localization between membrane invaginations labeled by Amph-N-BAR-YFP and microtubules labeled with mCherry-CLIP170. (B) Confocal images of membrane invaginations labeled with the Amph-N-BAR-YFP protein and their co-localization with polymerized actin labeled with LifeAct-mCherry protein. The cell orientation is such that the front is facing the lens. (C) Co-localization of membrane invaginations in polarized PGCs labeled by Amph-N-BAR-YFP with polymerized actin labeled with LifeAct-mCherry protein. The cell front faces upper right. (D) Membrane invaginations labeled with the Amph-N-BAR-YFP protein in cells in which contractility was inhibited by the expression of a dominant-negative form of ROCK (DN-ROCK). mCherry-F labels the plasma membrane. (E) Dominant-negative form of Cdc42 (DN-Cdc42) expressed in the cells reduces the number of dynamic membrane invaginations labeled with Amph-N-BAR YFP. Polymerized actin is labeled with LifeAct-mCherry protein. (F) Inhibition of Cdc42 function in a fraction of the PGC population led to mislocalization of the treated cells (yellow cells). The asterisks mark the migration target of the cells in 24 hpf embryos and the white arrowheads point to PGCs expressing a control or the DN-Cdc42 proteins. The graph shows the quantitation of the result (n = 41 and n = 38 embryos from two independent experiments). Median (1 and 5, respectively) and interquartile range are shown. The p value (∗∗∗∗p < 0.0001) was calculated using a non-parametric Mann-Whitney U test. Scale bars, 5 μm. |
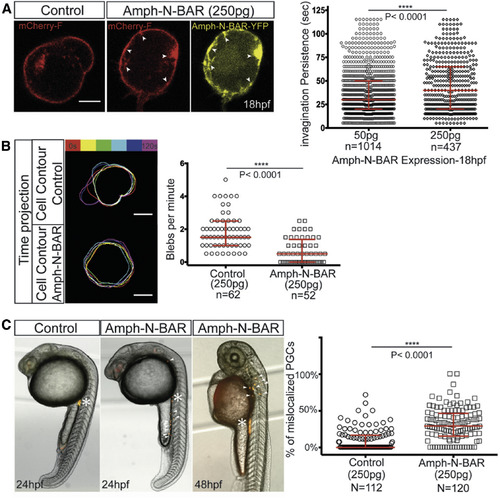
Release of Membrane Invaginations Is Required for Cell Blebbing In Vivo (A) The morphology of a wild-type PGC at 18 hpf, injected with control RNA (left) and of a PGC expressing high levels of the amphiphysin N-BAR domain (two right panels). Domains of increased plasma membrane accumulation (mCherry-F label, red) are observed at locations where high levels of YFP-tagged N-BAR domain protein (yellow) are present (arrowheads). The graph on the right presents the persistence of the invaginations as measured over 2 min under conditions of low (50 pg, n = 1,014 in 28 cells) and high (250 pg, n = 437 in 33 cells) amounts of RNA injected per embryo. Three independent experiments were conducted with a median of 30 s (for 50 pg) and 40 s (for 250 pg). Scale bar, 5 μm. (B) An overlay of six membrane contours (each 20 s apart) of PGCs labeled with farnesylated mCherry in control (250 pg RNA, upper) and in cells overexpressing the amphiphysin N-BAR domain (250 pg RNA, lower), with the graph showing the number of blebs per minute (n is the number of cells analyzed, median = 1.5 and 0.5 for control and N-BAR expression, respectively). Scale bar, 5 μm. (C) PGCs expressing high levels of the amphiphysin N-BAR domain protein exhibit defects in arrival at the region where the gonad develops. Asterisks label the migration target of PGCs in 24-hpf and 48-hpf embryos, and arrowheads point to some of the mislocalized PGCs. The graph presents the percentage of mislocalized PGCs in control and in PGCs expressing RNA encoding for the N-BAR domain protein (250 pg, N is the number of embryos analyzed) (median = 0% and 29% for control and Amph-N-BAR respectively, data obtained from three independent experiments). The p value (∗∗∗∗p < 0.0001) was calculated using a non-parametric Mann-Whitney U test. The graphs show medians and interquartile ranges. See also Figure S5. |
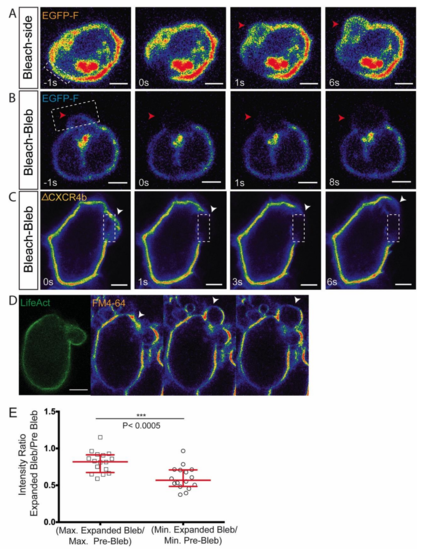
Lack of directed membrane flow during bleb formation. Related to Figure 2. (A) An area of Farnesylated-EGFP labeled membrane adjacent to a forming bleb (arrowhead) was photobleached and the distribution of the fluorescence was assessed. Despite the expansion of the bleb, no directional material flow could be observed, 10 cells analyzed. (B) Photobleaching of Farnesylated-EGFP on the membrane of an inflating bleb (red arrowheads) reveals expansion of the dark area during bleb formation, 10 cells analyzed. (C) Photobleaching of a truncated non-internalizable, non-ligand binding form of Cxcr4b fused to EGFP. The photobleaching experiment reveals no membrane flow in the direction of the region where blebs are formed (white arrowheads), 5 cells were analyzed. (D) EGFP LifeAct–expressing PGC located within the tissue of a deyolked embryo (to allow lipid-dye labeling, see methods). The fluorescence level of the lipid dye FM4-64 observed in a single optical plane shows non-uniform signal intensity and a reduction in signal within the inflating bleb (arrowhead). (E) Normalized maximum and minimum intensity ratios of the lipid dye, FM4-64 over 3 Z-planes (maximum intensity projection) (n=16 cells). The graph shows median and interquartile range. P value was calculated using non-parametric Mann Whitney U test. Scale bars=5µm. |
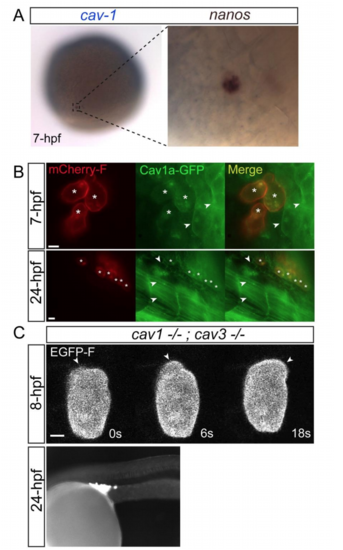
The role of caveolae in blebbing. Related to Figure 4 (A) Two-color in-situ hybridization for caveolin1 (blue) and nanos3 (brown) mRNAs showing their co-expression within a PGC. (B) Global expression of Cav1a-GFP in PGCs and in somatic cells at 7hpf (upper panel) and 24hpf (lower panel), with the membrane of the PGCs labeled with mCherry-F (asterisks). Arrowheads point at membrane localization of the Cav1a-GFP to the plasma membrane of nearby somatic cells, while the PGC membrane is largely devoid of GFP signal. (C) Formation of blebs (arrowheads) at the front of a cav-1; cav-3 maternal-zygotic mutant migrating live PGC (upper panels, 8hpf) and proper arrival of the PGCs at the position where the gonad develops in 24hpf embryo of the same genotype (lower panel, 24hpf). The experiments were performed 3 times, with a total of 28 wild-type and 12 mz cav1; cav3 embryos assessed. Scale bar=5 µm. |
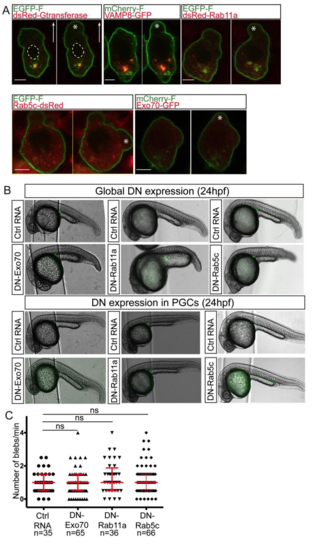
The role of vesicle trafficking in blebbing. Related to Figure 4 (A) Labeling of the Golgi apparatus in a migrating PGC using human beta 1, 4- galactosyltransferase target sequence fused to dsRed (dsRed-Gtransferase). The plasma membrane is labeled with EGFP-F or with mCherry-F (presented in green). Arrow shows the direction of migration and the position of the nucleus is outlined with the dashed-lines. Localization of different vesicle markers including VAMP8, Rab11a, Rab5c and Exo70 and their position relative to the forming bleb (asterisk). (B) 24 hpf embryos globally expressing control RNA or dominant negative (DN) forms of Exo70, Rab11a and Rab5c (upper two rows) and 24 hpf embryos expressing the same dominant negative forms preferentially in the PGCs by employing the nanos3 3’UTR (lower two rows). In all cases, the PGCs reach their clustering position. (C) PGCs expressing the dominant-negative of Exo70, Rab11a and Rab5c show a frequency of bleb formation similar to that of control cells. Scale bar=5 µm. Statistical analysis was conducted using the Kruskal-Wallis test, with P value= 0.1, ns. The graph presents the combined data from 3 independent experiments. The graphs show median and interquartile range. Ctrl stands for Control RNA. |

Cytoplamic flow during bleb formation. Related to Figure 1 Confocal image of a PGC labeled with farnesylated mCherry and cytoplasmic GFP. The asterisk in upper row marks the location of bleb inflation. The cytoplasmic GFP signal is presented in pseudocolors in the second row and third row presents an overlay of cytoplasm and membrane signals. Dashed rectangle marks the area of the forming bleb, magnified in the bottom (bleb) panel. Scale bar= 5µm. Similar observations were made in 13 cells and 38 blebs. The ratio between the cytoplasmic GFP signal intensity within the bleb divided by the prebleb cytoplasm signal intensity was not substantially different (median=0.98, interquartile range (0.91-1.03). |
Reprinted from Developmental Cell, 43(5), Goudarzi, M., Tarbashevich, K., Mildner, K., Begemann, I., Garcia, J., Paksa, A., Reichman-Fried, M., Mahabaleshwar, H., Blaser, H., Hartwig, J., Zeuschner, D., Galic, M., Bagnat, M., Betz, T., Raz, E., Bleb Expansion in Migrating Cells Depends on Supply of Membrane from Cell Surface Invaginations, 577-587.e5, Copyright (2017) with permission from Elsevier. Full text @ Dev. Cell