
|
Fig. 1
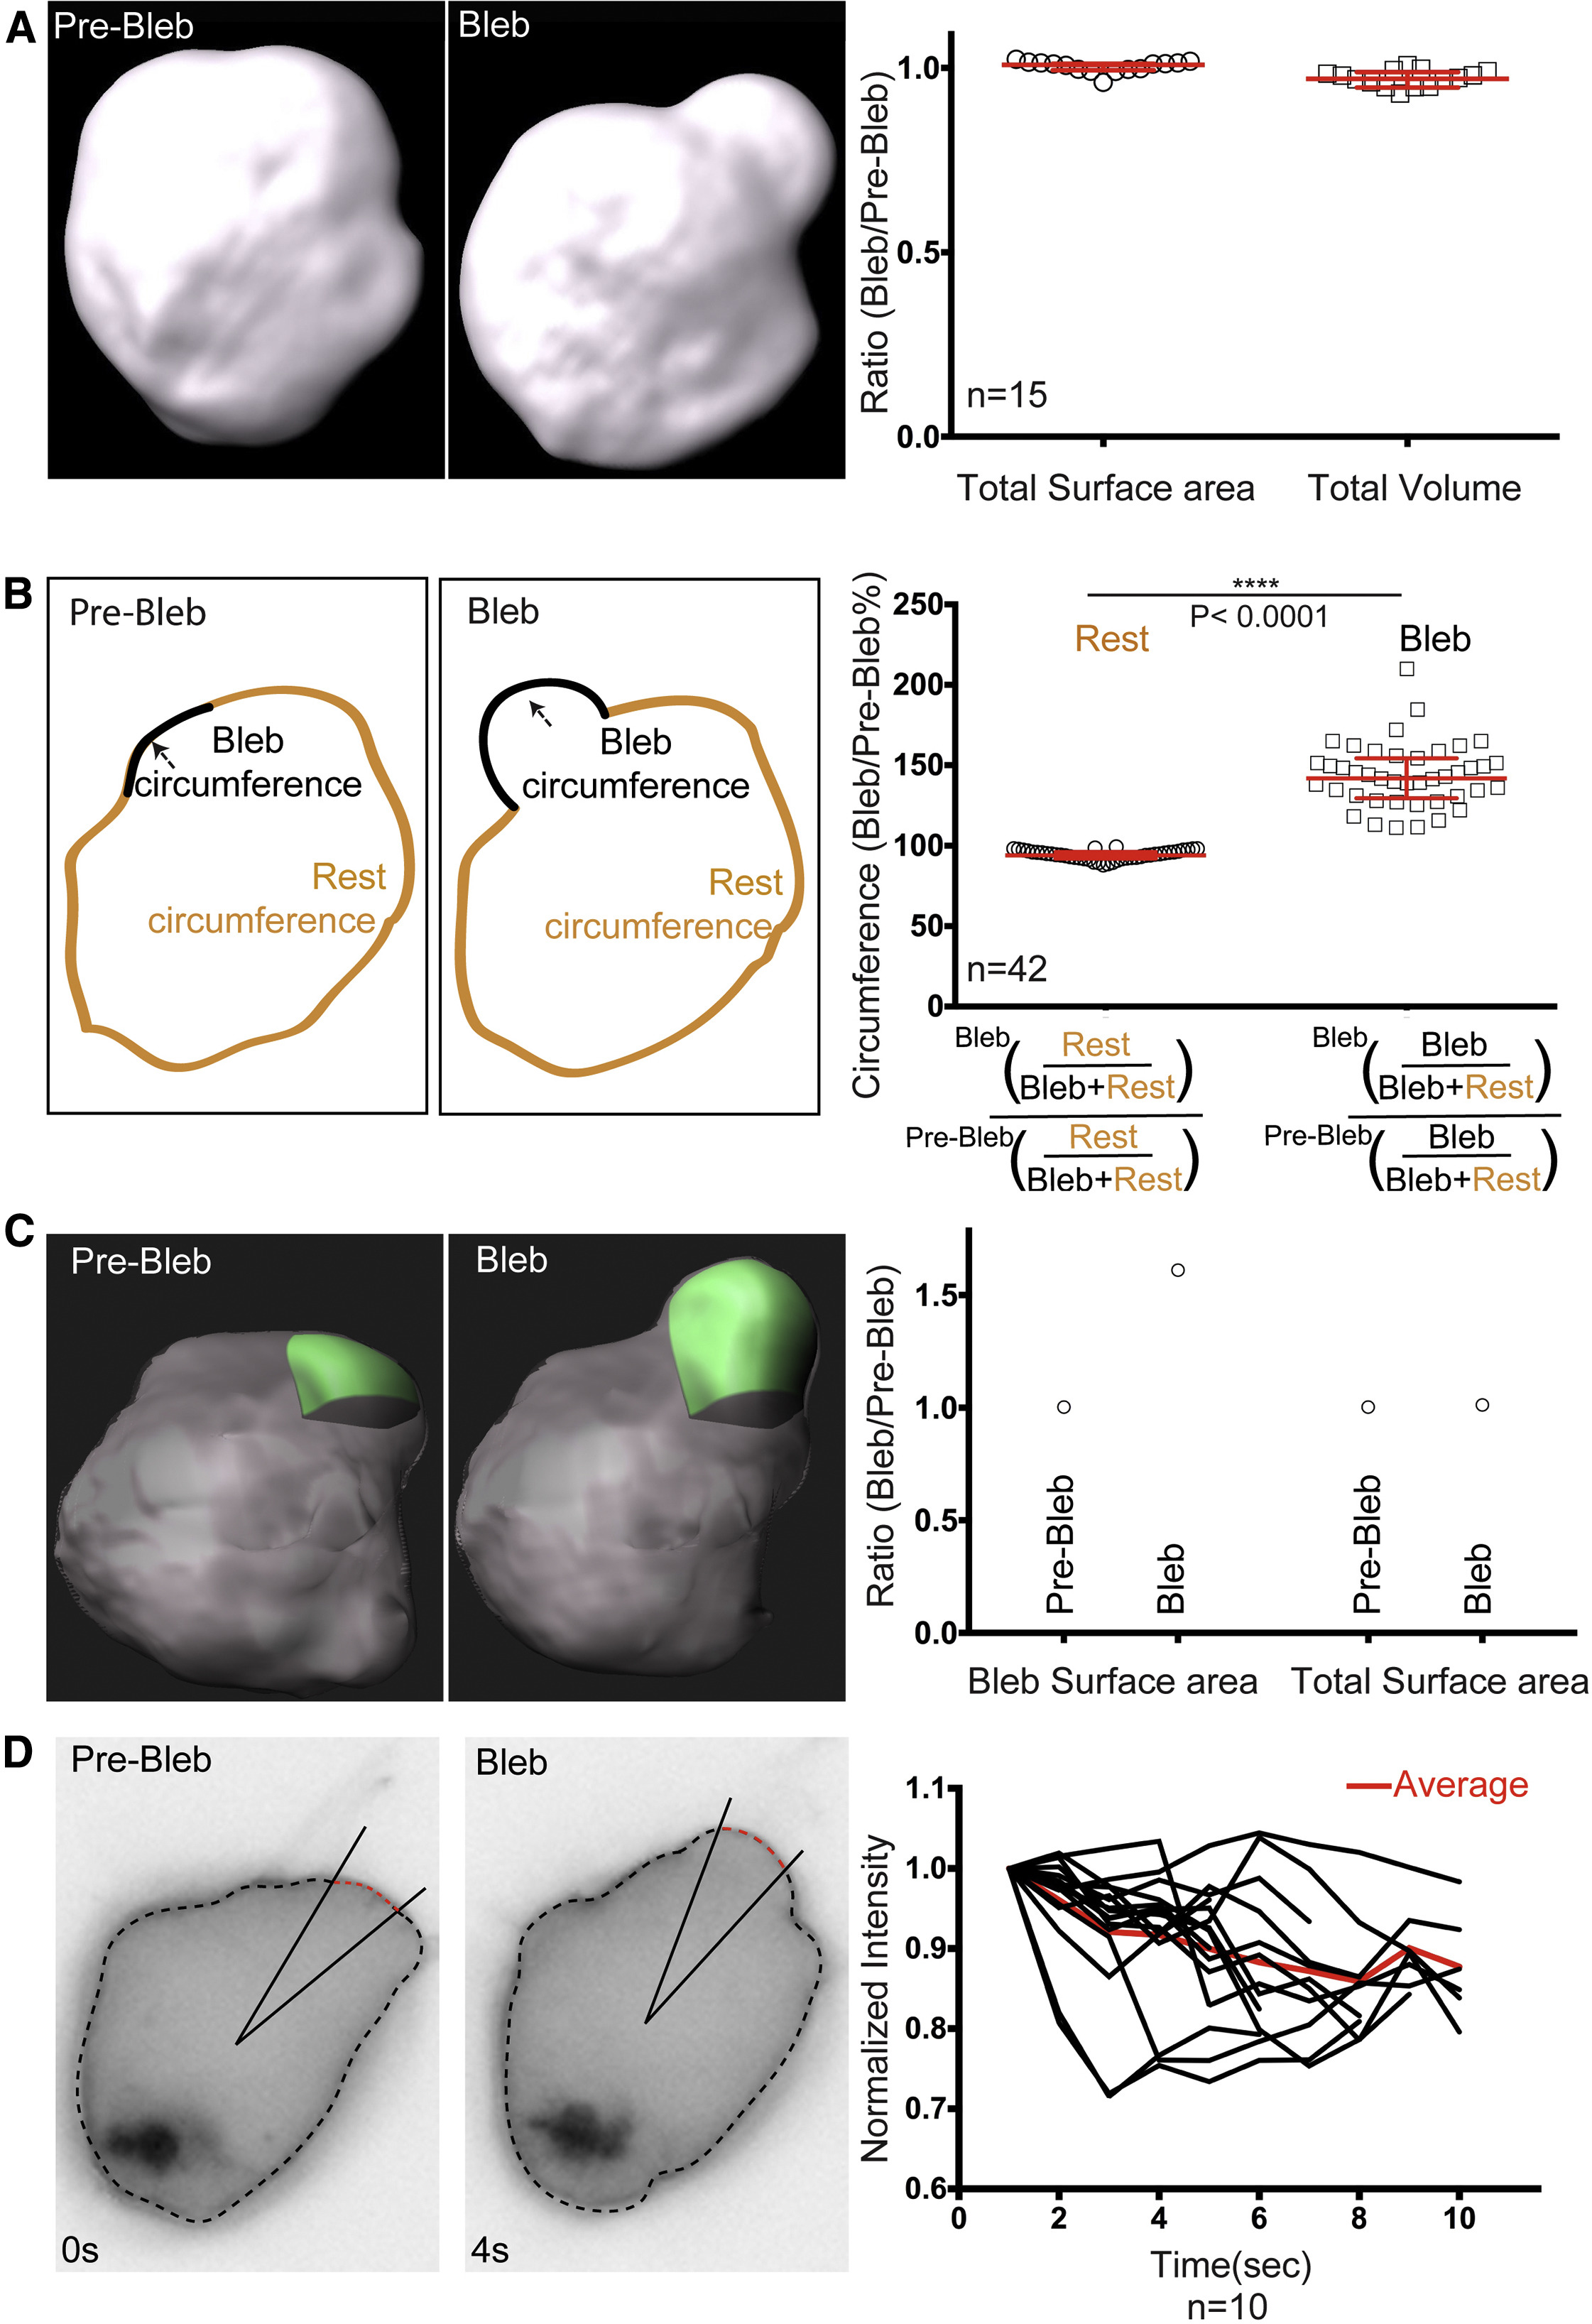
Cell Shape and Membrane Characteristics during Bleb Inflation In Vivo
(A) 3D reconstruction showing a PGC before and after bleb inflation. The graph on the right shows the ratio of the cell surface area and the volume comparing bleb with the pre-bleb time points.
(B) Schematic view of a PGC circumference prior to and following bleb formation, with black and orange colors representing the measured areas. The graph shows the ratio between the circumference of cells excluding the bleb area before and after bleb expansion (normalized to the whole-cell circumference) and the same ratio for the bleb area (median = 94.1% and 141.8% for “Rest” and “Bleb,” respectively). The circumference of the bleb prior to inflation was defined as the membrane length of the bleb neck at the pre-bleb time point.
(C) 3D surface reconstruction for bleb (green) and the whole cell (gray) prior and after bleb expansion. The graph on the right shows the change in surface area of the bleb and the whole cell, before (Pre-Bleb) and after (Bleb) bleb expansion.
(D) A PGC expressing farnesylated EGFP protein prior to and following bleb inflation. The cell outline was calculated using the Radial analysis program (see STAR Methods) and the bleb was defined by the change in the velocity of the plasma membrane. The central half of the bleb region (red dashed line) was monitored over time and the fluorescence intensities were plotted (right). The average intensity obtained from 10 measurements is presented in red.
The graphs in (A) and (B) show median and interquartile range for data obtained in three independent experiments. The p value (∗∗∗∗p < 0.0001) was calculated using a non-parametric Mann-Whitney U test. n represents the number of blebs analyzed. In all of the panels the PGC membrane was labeled with farnesylated EGFP. See also Figure S6.
Reprinted from Developmental Cell, 43(5), Goudarzi, M., Tarbashevich, K., Mildner, K., Begemann, I., Garcia, J., Paksa, A., Reichman-Fried, M., Mahabaleshwar, H., Blaser, H., Hartwig, J., Zeuschner, D., Galic, M., Bagnat, M., Betz, T., Raz, E., Bleb Expansion in Migrating Cells Depends on Supply of Membrane from Cell Surface Invaginations, 577-587.e5, Copyright (2017) with permission from Elsevier. Full text @ Dev. Cell