
Fig. 3
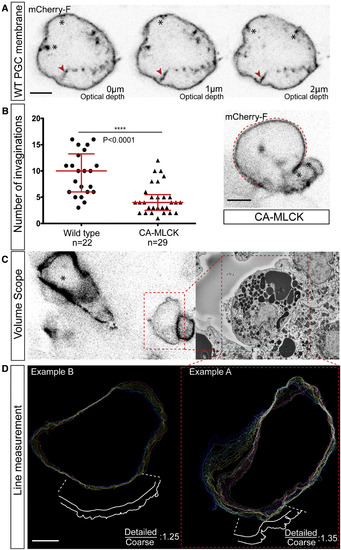
Detailed Analysis of PGCs within the Tissue Reveals Membrane Invaginations (A) Three confocal planes of a PGC plasma membrane labeled with farnesylated mCherry providing a z axis view of invaginations extending into the cell interior. One such invagination is highlighted with a red arrowhead at each of the three planes. Note that in the first plane, the connection of the structure to the membrane is not clearly seen, such that it resembles a vesicle. Additional invaginations connected to the plasma membrane are marked with black asterisks. (B) The graph shows the number of membrane invaginations in wild-type PGCs and in PGCs with elevated contractility (CA-MLCK), with an example for a manipulated cell presented on the right (n = 22 and n = 29 cells from 6 to 19 embryos, respectively; the graph shows the combined data from two independent experiments). The red dashed line highlights the contour of a large traveling bleb with black asterisks marking membrane invaginations within the cell body (see also Movie S4D). The p value (∗∗∗∗p < 0.0001) is calculated using a non-parametric Mann-Whitney U test. (C) Localization of PGCs for the correlative EM analysis, employing an arrowhead-shaped laser mark (asterisk). The dashed area labels one of the PGCs studied in the Teneo VolumeScope (right panel). (D) The Teneo VolumeScope data was used to measure the extent of extra plasma membrane stored in invaginations and wrinkles in PGCs (excluding long membrane tubes that span multiple planes). Every 200 nm the circumference of the cell was outlined, either by following the invaginations and wrinkles precisely or by crude tracing of the cell circumference (see example in the magnified region at the bottom). The ratio between the circumference lengths obtained using the detailed Teneo VolumeScope data and the coarse estimate for two cells is presented (29 and 15 sections were used for example A and B, respectively). Scale bars, 5 μm. See also Figure S2. |
Reprinted from Developmental Cell, 43(5), Goudarzi, M., Tarbashevich, K., Mildner, K., Begemann, I., Garcia, J., Paksa, A., Reichman-Fried, M., Mahabaleshwar, H., Blaser, H., Hartwig, J., Zeuschner, D., Galic, M., Bagnat, M., Betz, T., Raz, E., Bleb Expansion in Migrating Cells Depends on Supply of Membrane from Cell Surface Invaginations, 577-587.e5, Copyright (2017) with permission from Elsevier. Full text @ Dev. Cell