
Fig. 6
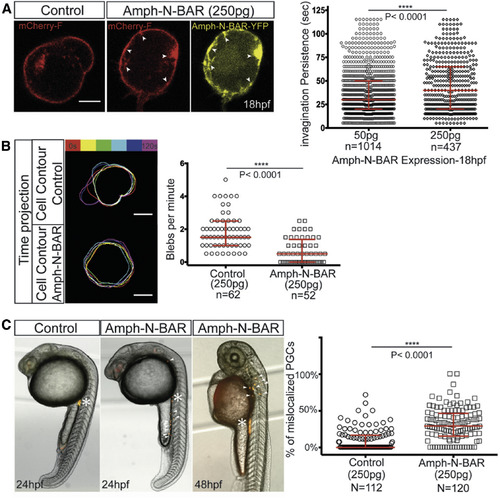
Release of Membrane Invaginations Is Required for Cell Blebbing In Vivo (A) The morphology of a wild-type PGC at 18 hpf, injected with control RNA (left) and of a PGC expressing high levels of the amphiphysin N-BAR domain (two right panels). Domains of increased plasma membrane accumulation (mCherry-F label, red) are observed at locations where high levels of YFP-tagged N-BAR domain protein (yellow) are present (arrowheads). The graph on the right presents the persistence of the invaginations as measured over 2 min under conditions of low (50 pg, n = 1,014 in 28 cells) and high (250 pg, n = 437 in 33 cells) amounts of RNA injected per embryo. Three independent experiments were conducted with a median of 30 s (for 50 pg) and 40 s (for 250 pg). Scale bar, 5 μm. (B) An overlay of six membrane contours (each 20 s apart) of PGCs labeled with farnesylated mCherry in control (250 pg RNA, upper) and in cells overexpressing the amphiphysin N-BAR domain (250 pg RNA, lower), with the graph showing the number of blebs per minute (n is the number of cells analyzed, median = 1.5 and 0.5 for control and N-BAR expression, respectively). Scale bar, 5 μm. (C) PGCs expressing high levels of the amphiphysin N-BAR domain protein exhibit defects in arrival at the region where the gonad develops. Asterisks label the migration target of PGCs in 24-hpf and 48-hpf embryos, and arrowheads point to some of the mislocalized PGCs. The graph presents the percentage of mislocalized PGCs in control and in PGCs expressing RNA encoding for the N-BAR domain protein (250 pg, N is the number of embryos analyzed) (median = 0% and 29% for control and Amph-N-BAR respectively, data obtained from three independent experiments). The p value (∗∗∗∗p < 0.0001) was calculated using a non-parametric Mann-Whitney U test. The graphs show medians and interquartile ranges. See also Figure S5. |
Reprinted from Developmental Cell, 43(5), Goudarzi, M., Tarbashevich, K., Mildner, K., Begemann, I., Garcia, J., Paksa, A., Reichman-Fried, M., Mahabaleshwar, H., Blaser, H., Hartwig, J., Zeuschner, D., Galic, M., Bagnat, M., Betz, T., Raz, E., Bleb Expansion in Migrating Cells Depends on Supply of Membrane from Cell Surface Invaginations, 577-587.e5, Copyright (2017) with permission from Elsevier. Full text @ Dev. Cell