
- Title
-
Serotonin Activated Hepatic Stellate Cells Contribute to Sex Disparity in Hepatocellular Carcinoma
- Authors
- Yang, Q., Yan, C., Yin, C., Gong, Z.
- Source
- Full text @ Cell Mol Gastroenterol Hepatol
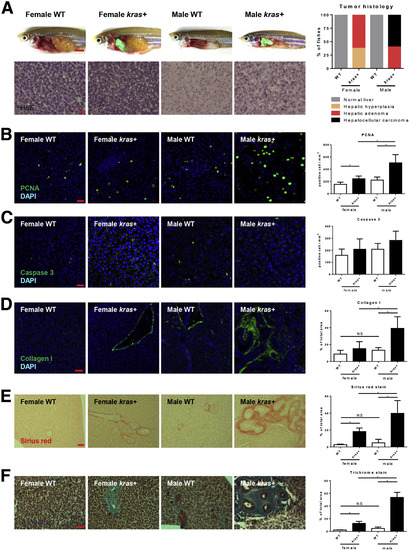
Sex disparity in krasV12-induced HCC progression. Three-month-old adult zebrafish were treated with 30 μg/mL dox for 7 days and examined by various assays as described in the text. (A) Gross morphology and histology of kras+ and WT (control) male and female zebrafish after dox exposure. Male krasV12-expressing liver (green for green fluorescent protein expression) were enlarged significantly as compared with female krasV12-expressing liver and also with WT male and female livers (dotted line enclosed). Bottom left: H&E staining of the liver sections of dox-treated kras+ and WT (control) male and female zebrafish. Right: Quantification of tumor histology observed in the H&E-stained liver sections of dox-treated kras+ male and female zebrafish is shown (n = 10 each group). (B–D) IF staining of (B) PCNA, (C) caspase 3, and (D) collagen I in liver sections of dox-treated kras+ and WT male and female zebrafish. Quantifications of stained cells are shown on the right (n > 8 in each group). (E) Picrosirius Red staining of the liver sections of dox-treated kras+ and WT male and female zebrafish. Quantification of fibrotic liver tissue area in Picrosirius Red–stained liver sections is shown on the right (n > 10 in each group). (F) Gomori’s trichrome staining of the liver sections of dox-treated kras+ and WT male and female zebrafish. Quantification of fibrotic liver tissue area in Gomori’s trichrome–stained liver sections is shown on the right (n > 8 in each group). *P < .05. Scale bars: (A) 3 mm (top row), 20 μm (bottom row), (E–F) 500 μm, (D) 50 μm, and (B and C) 20 μm. DAPI,4',6-diamidino-2-phenylindole. |
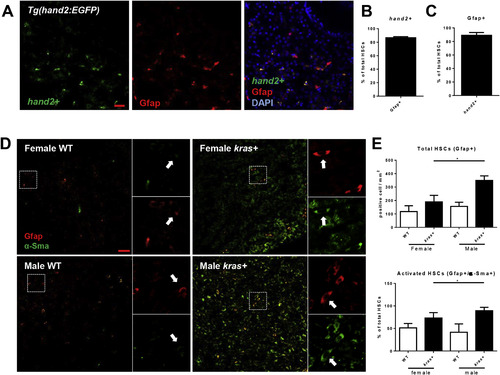
Sex disparate increase of HSCs and activated HSCs after krasV12induction. (A) Overlap of hand2+ and Gfap expression. Gfap expression was examined in liver sections of hand2+ transgenic fish with 4',6-diamidino-2-phenylindole (DAPI) staining for nuclei (blue) 8 days after fertilization. (B) Percentage of Gfap+ HSCs as marked by hand2:gfp expression in liver sections (n = 20). (C) Percentage of hand2+ HSCs as marked by Gfap+ expression in liver sections (n = 20). (D) IF co-staining of GFAP (red, general HSCs) and α-Sma (green, activated HSCs) in liver sections of adult zebrafish. Three-month-old kras+ and WT, male and female zebrafish were treated with 30 μg/mL dox for 7 days. Total HSCs, activated HSCs, and serotonin were examined. White boxes indicate enlarged regions shown on the right of each photograph. Arrows indicate Gfap+ cells. (E) Quantification of HSC density (Gfap+, top) and percentages of activated HSCs (Gfap+/α-Sma+, bottom) in liver sections (n > 8 in each group). *P < .05. Scale bar: 20 μm. |
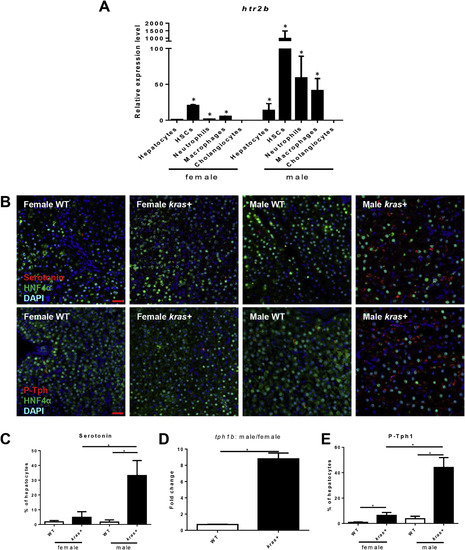
Htr2b expression and serotonin production after krasV12induction. (A) Expression of htr2b in hepatocytes, HSCs, neutrophils, macrophages, and cholangiocytes. These cells were isolated by fluorescence-activated cell sorting based on DsRed, GFP, DsRed, mCherry, and GFP expression, respectively from fabp10+, hand2+, lyz+, mpeg+, and tp1+ transgenic zebrafish. Total RNA was extracted and htr2b expression was determined by reverse-transcription quantitative PCR. Relative expression levels are shown with the value from female hepatocytes set as 1. (B) IF co-staining of Hnf4a/Serotonin (top) and Hnf4a/P-Tph1 in liver sections. Three-month-old kras+ and WT, male and female zebrafish were treated with 30 μg/mL dox for 7 days. Serotonin and P-Tph level were examined. (C) Quantification of serotonin-positive hepatocytes in these zebrafish (n > 8 in each group). (D) Reverse-transcription quantitative PCR determination of tph1b expression in hepatocytes isolated by fluorescence-activated cell sorting from dox-treated kras+ and fabp10+ (kras- control) male and female fish. Fold change is shown between males and females in WT and kras+ fish. (E) Quantification of percentage of P-Tph1–positive hepatocytes in these zebrafish (n > 8 in each group). *P < .05. Scale bar: 20 μm. DAPI, 4',6-diamidino-2-phenylindole. |
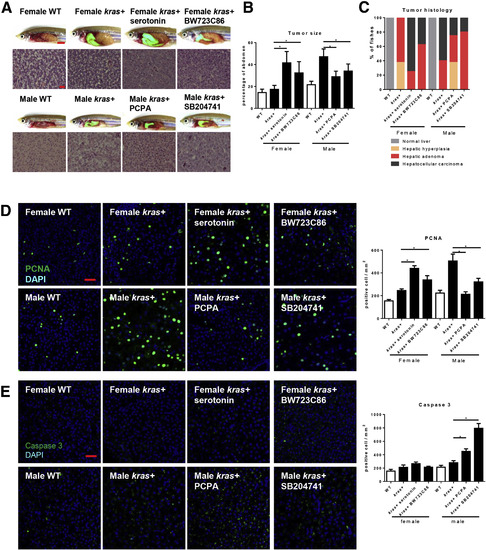
Effects of serotonin level and HSC activation on krasV12-induced carcinogenesis. Three-month-old adult zebrafish were treated with dox with or without serotonin, BW23C86, PCPA, and SB204741 for 7 days. (A) Gross morphology and H&E staining of liver sections. (B) Quantification of tumor size as a percentage of total abdominal area. (C) Quantification of tumor histology observed in the H&E-stained liver sections of these zebrafish is shown on the right (n > 8 in each group). (D and E) IF staining and quantification of (D) PCNA+ and (E) caspase 3+ cells in liver sections of these zebrafish (n > 8). *P < .05. Scale bars: (A) 3 mm for gross observation images and 20 μm for histology images, and (D and E) 20 μm. DAPI, 4',6-diamidino-2-phenylindole. |

Effects of serotonin level and HSC activation on krasV12-induced liver fibrosis. Three-month-old adult zebrafish were treated with dox with or without serotonin, BW23C86, PCPA, and SB204741 for 7 days. (A) IF staining of collagen I antibody and quantification of fibrotic liver tissue area in collagen I antibody–stained liver sections (n > 8 in each group). (B) Staining and quantification of fibrotic liver tissue area in Picrosirius Red–stained liver sections (n > 8 in each group). (C) Staining and quantification of fibrotic liver tissue area in Gomori’s trichrome–stained liver sections (n > 8 in each group). *P < .05. Scale bars: (A) 50 μm, and (B and C) 500 μm. DAPI, 4',6-diamidino-2-phenylindole. |
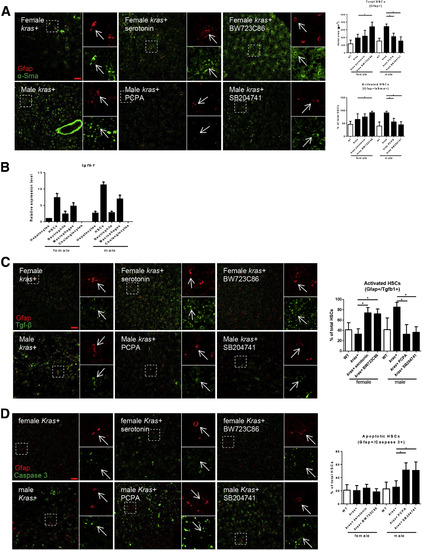
Manipulation of serotonin level and HSC density affects HSC activation and apoptosis. (A) IF staining and quantification of HSC density (Gfap+) in liver sections (n > 8 in each group). Three-month-old adult zebrafish were treated with dox with or without serotonin, BW23C86, PCPA, and SB204741 for 7 days. Percentages of activated HSCs (Gfap+/α-Sma+) in the liver sections (n > 8 in each group). (B) Expression of tgfb1 in hepatocytes, HSCs, neutrophils, macrophages, and cholangiocytes. These cells were isolated by fluorescence-activated cell sorting based on DsRed, GFP, DsRed, mCherry, and GFP expression, respectively, from fabp10+, hand2+, lyz+, mpeg+, and tp1+ transgenic zebrafish. Total RNAs were extracted and htr2b expression was determined by reverse-transcription quantitative PCR. Relative expression levels are with the values with female hepatocytes set as 1. (C and D) IF staining and quantification of percentages of (C) TgfB1+ HSCs (Gfap+/Tgfb1+) and (D) apoptotic HSCs in the liver sections as described in panel A. n > 8 in each group. *P < .05. Scale bar: 20 μm. |
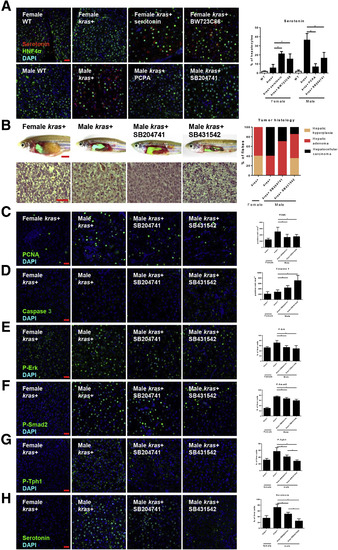
Tgfb1 promotes serotonin synthesis and krasV12-induced carcinogenesis. Three-month-old adult zebrafish were treated for 7 days with 30 μg/mL dox with or without 2 μmol/L serotonin, BW23C86, PCPA, and SB204741. (A) IF staining of serotonin in liver section of these zebrafish. These slides also were co-stained for hepatocytes (HNF4a) and nuclei (4′,6-diamidino-2-phenylindole [DAPI]). Right: Quantification of serotonin-positive liver cells as percentages of hepatocytes (n = 10). Three-month-old Male krasV12-expressing zebrafish were treated with dox with or without SB204741 and SB431542, respectively. (B) Gross morphology and H&E staining of liver sections of these zebrafish. Quantification of tumor histology observed in the H&E-stained liver sections of these zebrafish (n > 8 in each group). (C–H) IF staining and quantification of (C) PCNA+, (D) caspase 3+, (E) P-Erk+, (F) P-Smad2, (G) P-Tph+, and (H) serotonin+ cells in liver sections (n > 8 in each group). *P < .05. Scale bars: (B) 3 mm (toprow) and 50 μm (bottom row), and (A, C–H) 20 μm. |
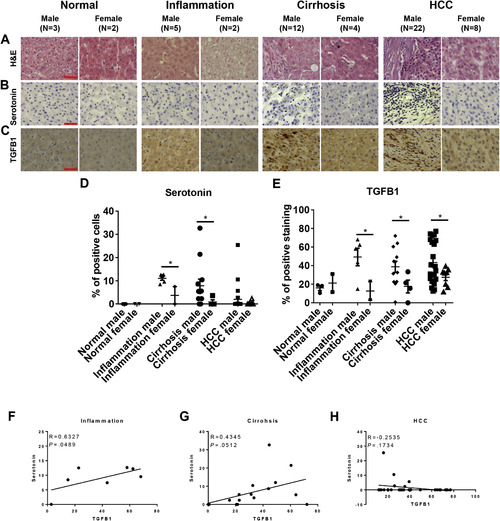
Sex difference in serotonin and TGFB1 levels in human liver disease samples. A panel of liver disease samples from human patients was examined for histology by H&E staining and for serotonin and TGFB1 levels by antibody staining. These samples were categorized into normal, inflammation, cirrhosis, and HCC for both males and females. (A) H&E staining of human liver disease samples. (B and C) IHC staining of antibody against (B) serotonin and (C) TGFB1. (D and E) Quantification of the percentages of (D) serotonin or (E) TGFB1-positive liver cells in inflammation, cirrhosis, and HCC patients. (F–H) Quantification of correlation between serotonin with TGFB1 in (F) inflammation, (G) cirrhosis, and (H) HCC patients. *P < .05. Scale bar: 20 μm. |