
Fig. 2
- ID
- ZDB-IMAGE-180105-2
- Genes
- Antibodies
- Publication
- Yang et al., 2017 - Serotonin Activated Hepatic Stellate Cells Contribute to Sex Disparity in Hepatocellular Carcinoma
- All Figures
- Figures for Yang et al., 2017
|
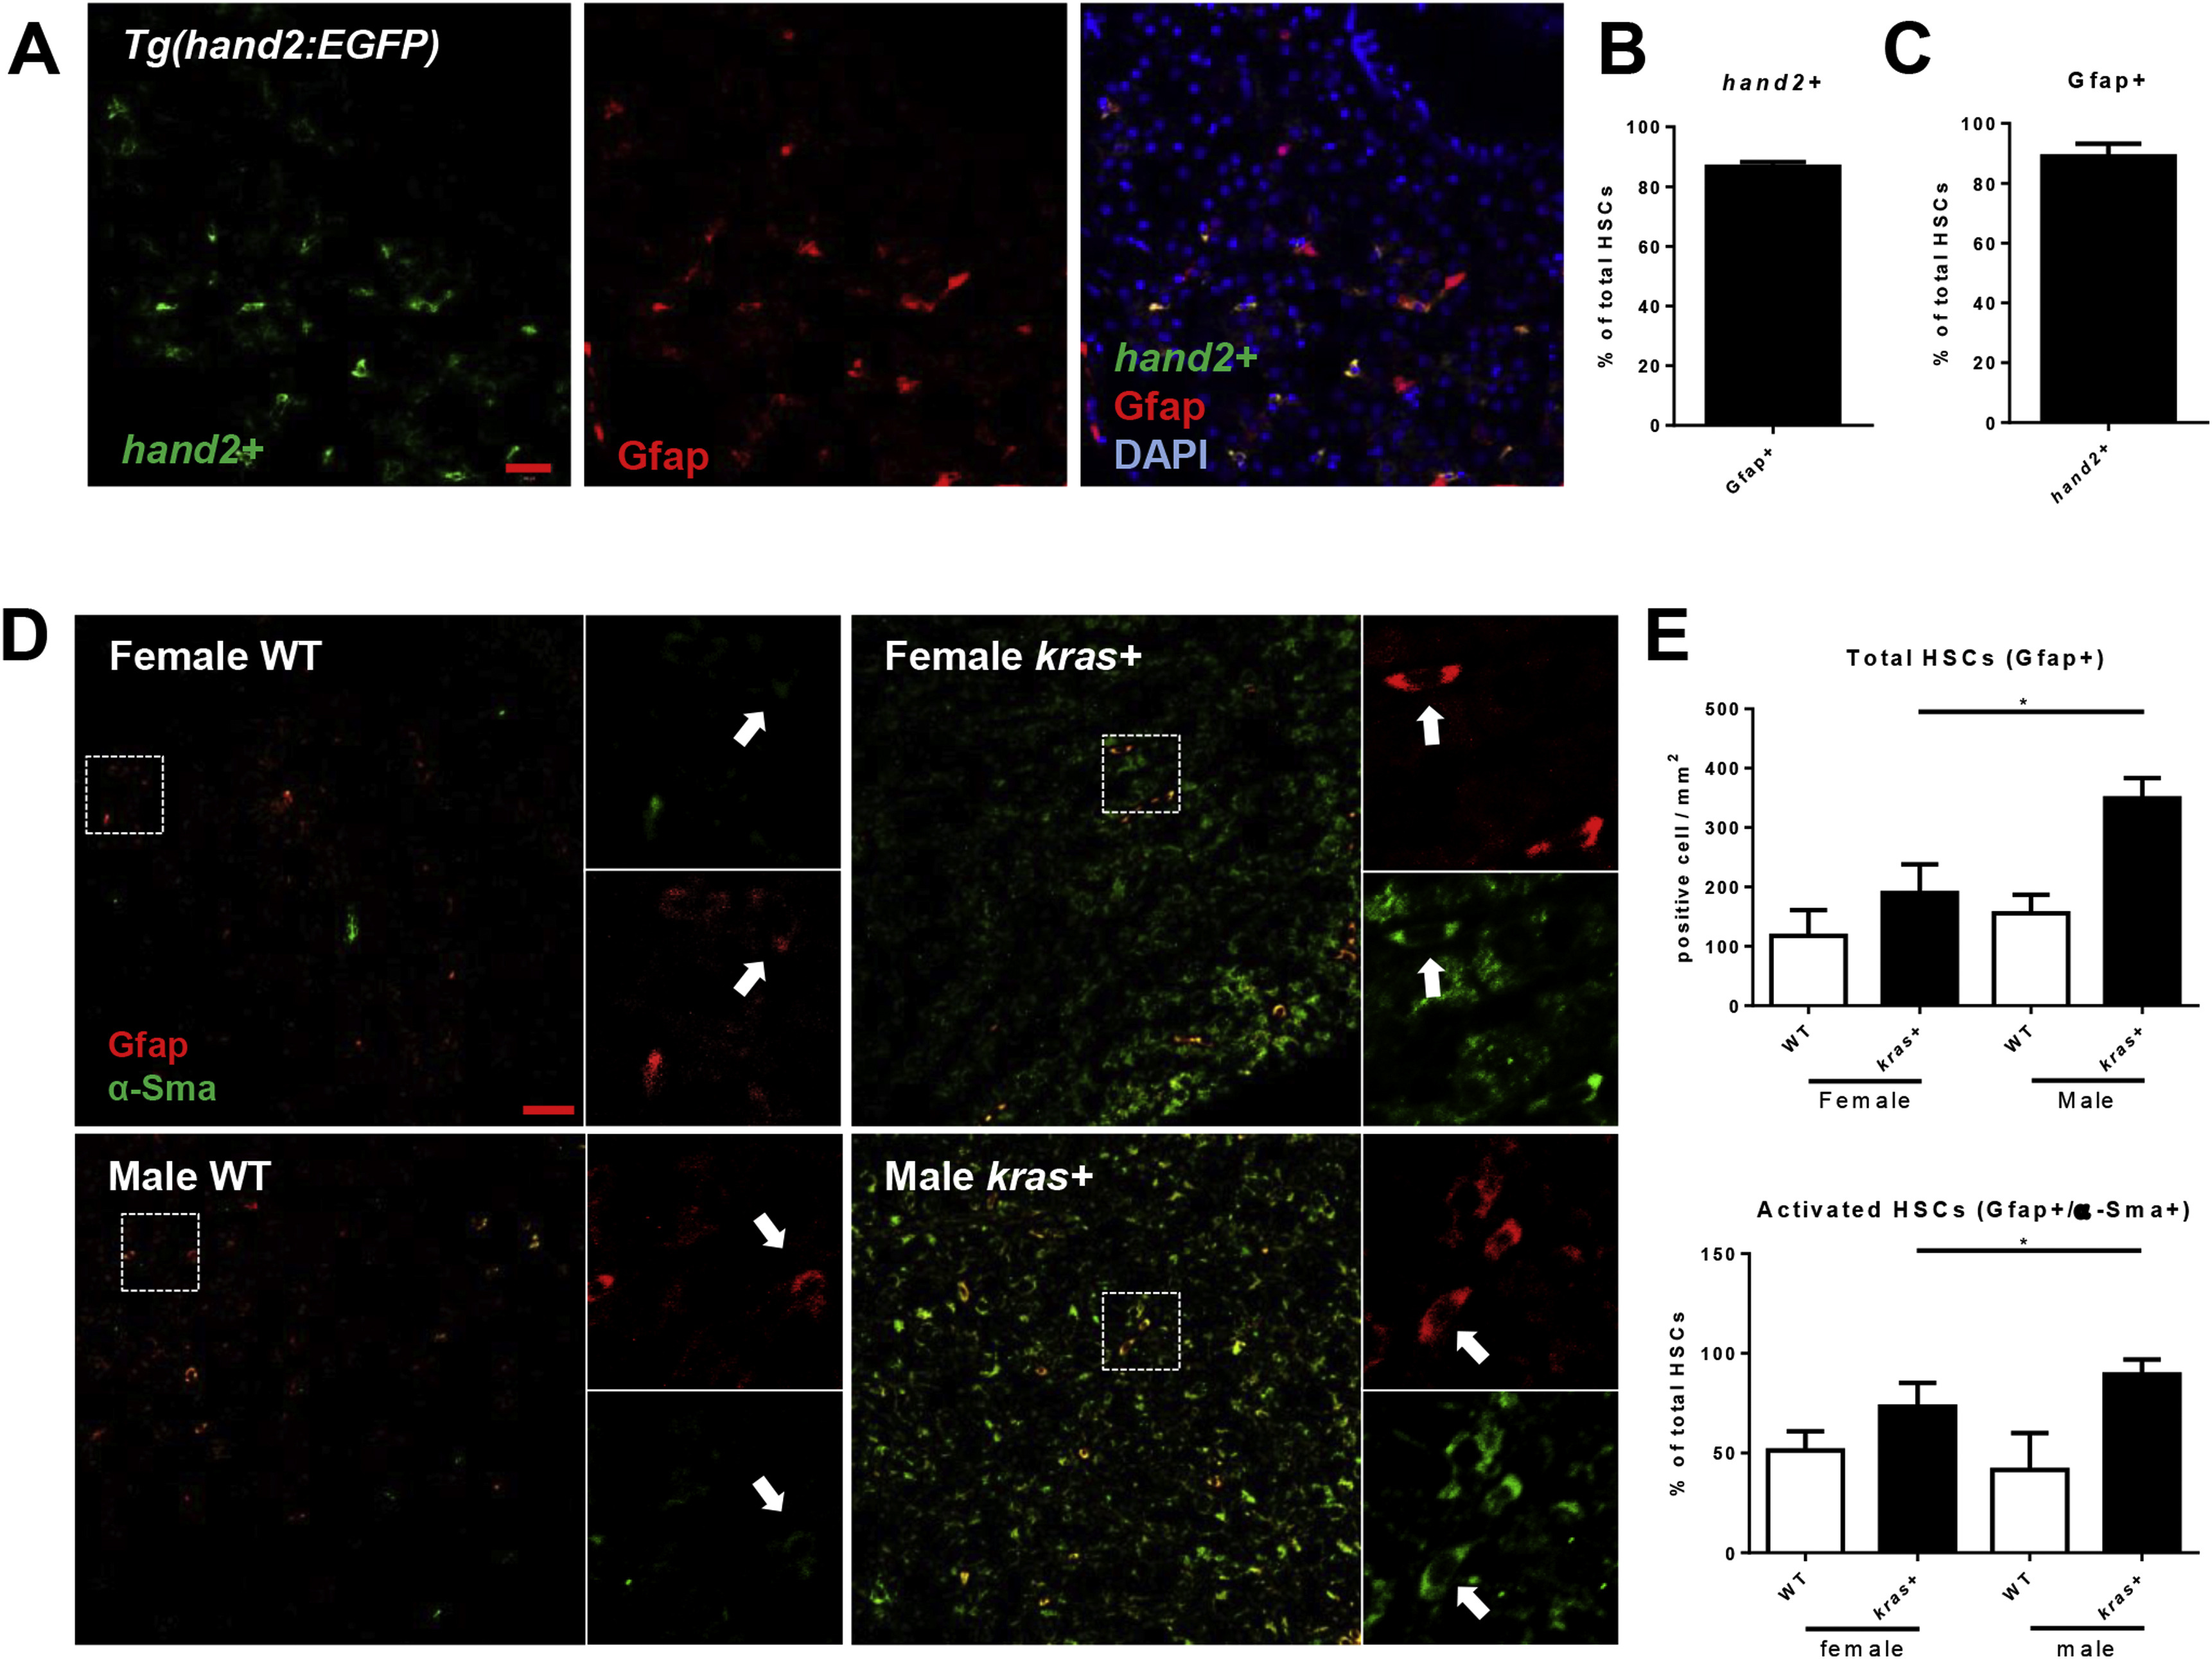
Fig. 2
Sex disparate increase of HSCs and activated HSCs after krasV12induction. (A) Overlap of hand2+ and Gfap expression. Gfap expression was examined in liver sections of hand2+ transgenic fish with 4',6-diamidino-2-phenylindole (DAPI) staining for nuclei (blue) 8 days after fertilization. (B) Percentage of Gfap+ HSCs as marked by hand2:gfp expression in liver sections (n = 20). (C) Percentage of hand2+ HSCs as marked by Gfap+ expression in liver sections (n = 20). (D) IF co-staining of GFAP (red, general HSCs) and α-Sma (green, activated HSCs) in liver sections of adult zebrafish. Three-month-old kras+ and WT, male and female zebrafish were treated with 30 μg/mL dox for 7 days. Total HSCs, activated HSCs, and serotonin were examined. White boxes indicate enlarged regions shown on the right of each photograph. Arrows indicate Gfap+ cells. (E) Quantification of HSC density (Gfap+, top) and percentages of activated HSCs (Gfap+/α-Sma+, bottom) in liver sections (n > 8 in each group). *P < .05. Scale bar: 20 μm.