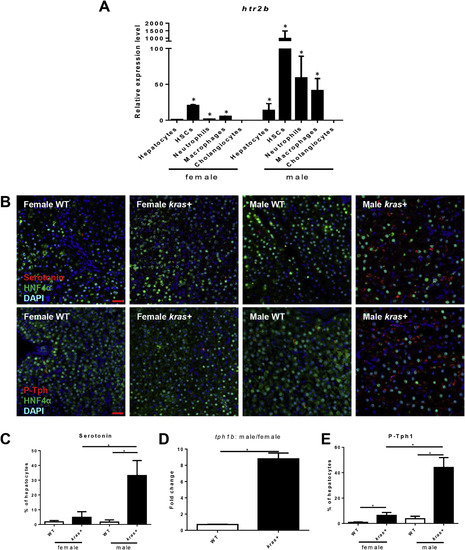
Htr2b expression and serotonin production after krasV12induction. (A) Expression of htr2b in hepatocytes, HSCs, neutrophils, macrophages, and cholangiocytes. These cells were isolated by fluorescence-activated cell sorting based on DsRed, GFP, DsRed, mCherry, and GFP expression, respectively from fabp10+, hand2+, lyz+, mpeg+, and tp1+ transgenic zebrafish. Total RNA was extracted and htr2b expression was determined by reverse-transcription quantitative PCR. Relative expression levels are shown with the value from female hepatocytes set as 1. (B) IF co-staining of Hnf4a/Serotonin (top) and Hnf4a/P-Tph1 in liver sections. Three-month-old kras+ and WT, male and female zebrafish were treated with 30 μg/mL dox for 7 days. Serotonin and P-Tph level were examined. (C) Quantification of serotonin-positive hepatocytes in these zebrafish (n > 8 in each group). (D) Reverse-transcription quantitative PCR determination of tph1b expression in hepatocytes isolated by fluorescence-activated cell sorting from dox-treated kras+ and fabp10+ (kras- control) male and female fish. Fold change is shown between males and females in WT and kras+ fish. (E) Quantification of percentage of P-Tph1–positive hepatocytes in these zebrafish (n > 8 in each group). *P < .05. Scale bar: 20 μm. DAPI, 4',6-diamidino-2-phenylindole.
|
