
Fig. 1
- ID
- ZDB-IMAGE-180105-1
- Antibodies
- Publication
- Yang et al., 2017 - Serotonin Activated Hepatic Stellate Cells Contribute to Sex Disparity in Hepatocellular Carcinoma
- All Figures
- Figures for Yang et al., 2017
|
Fig. 1
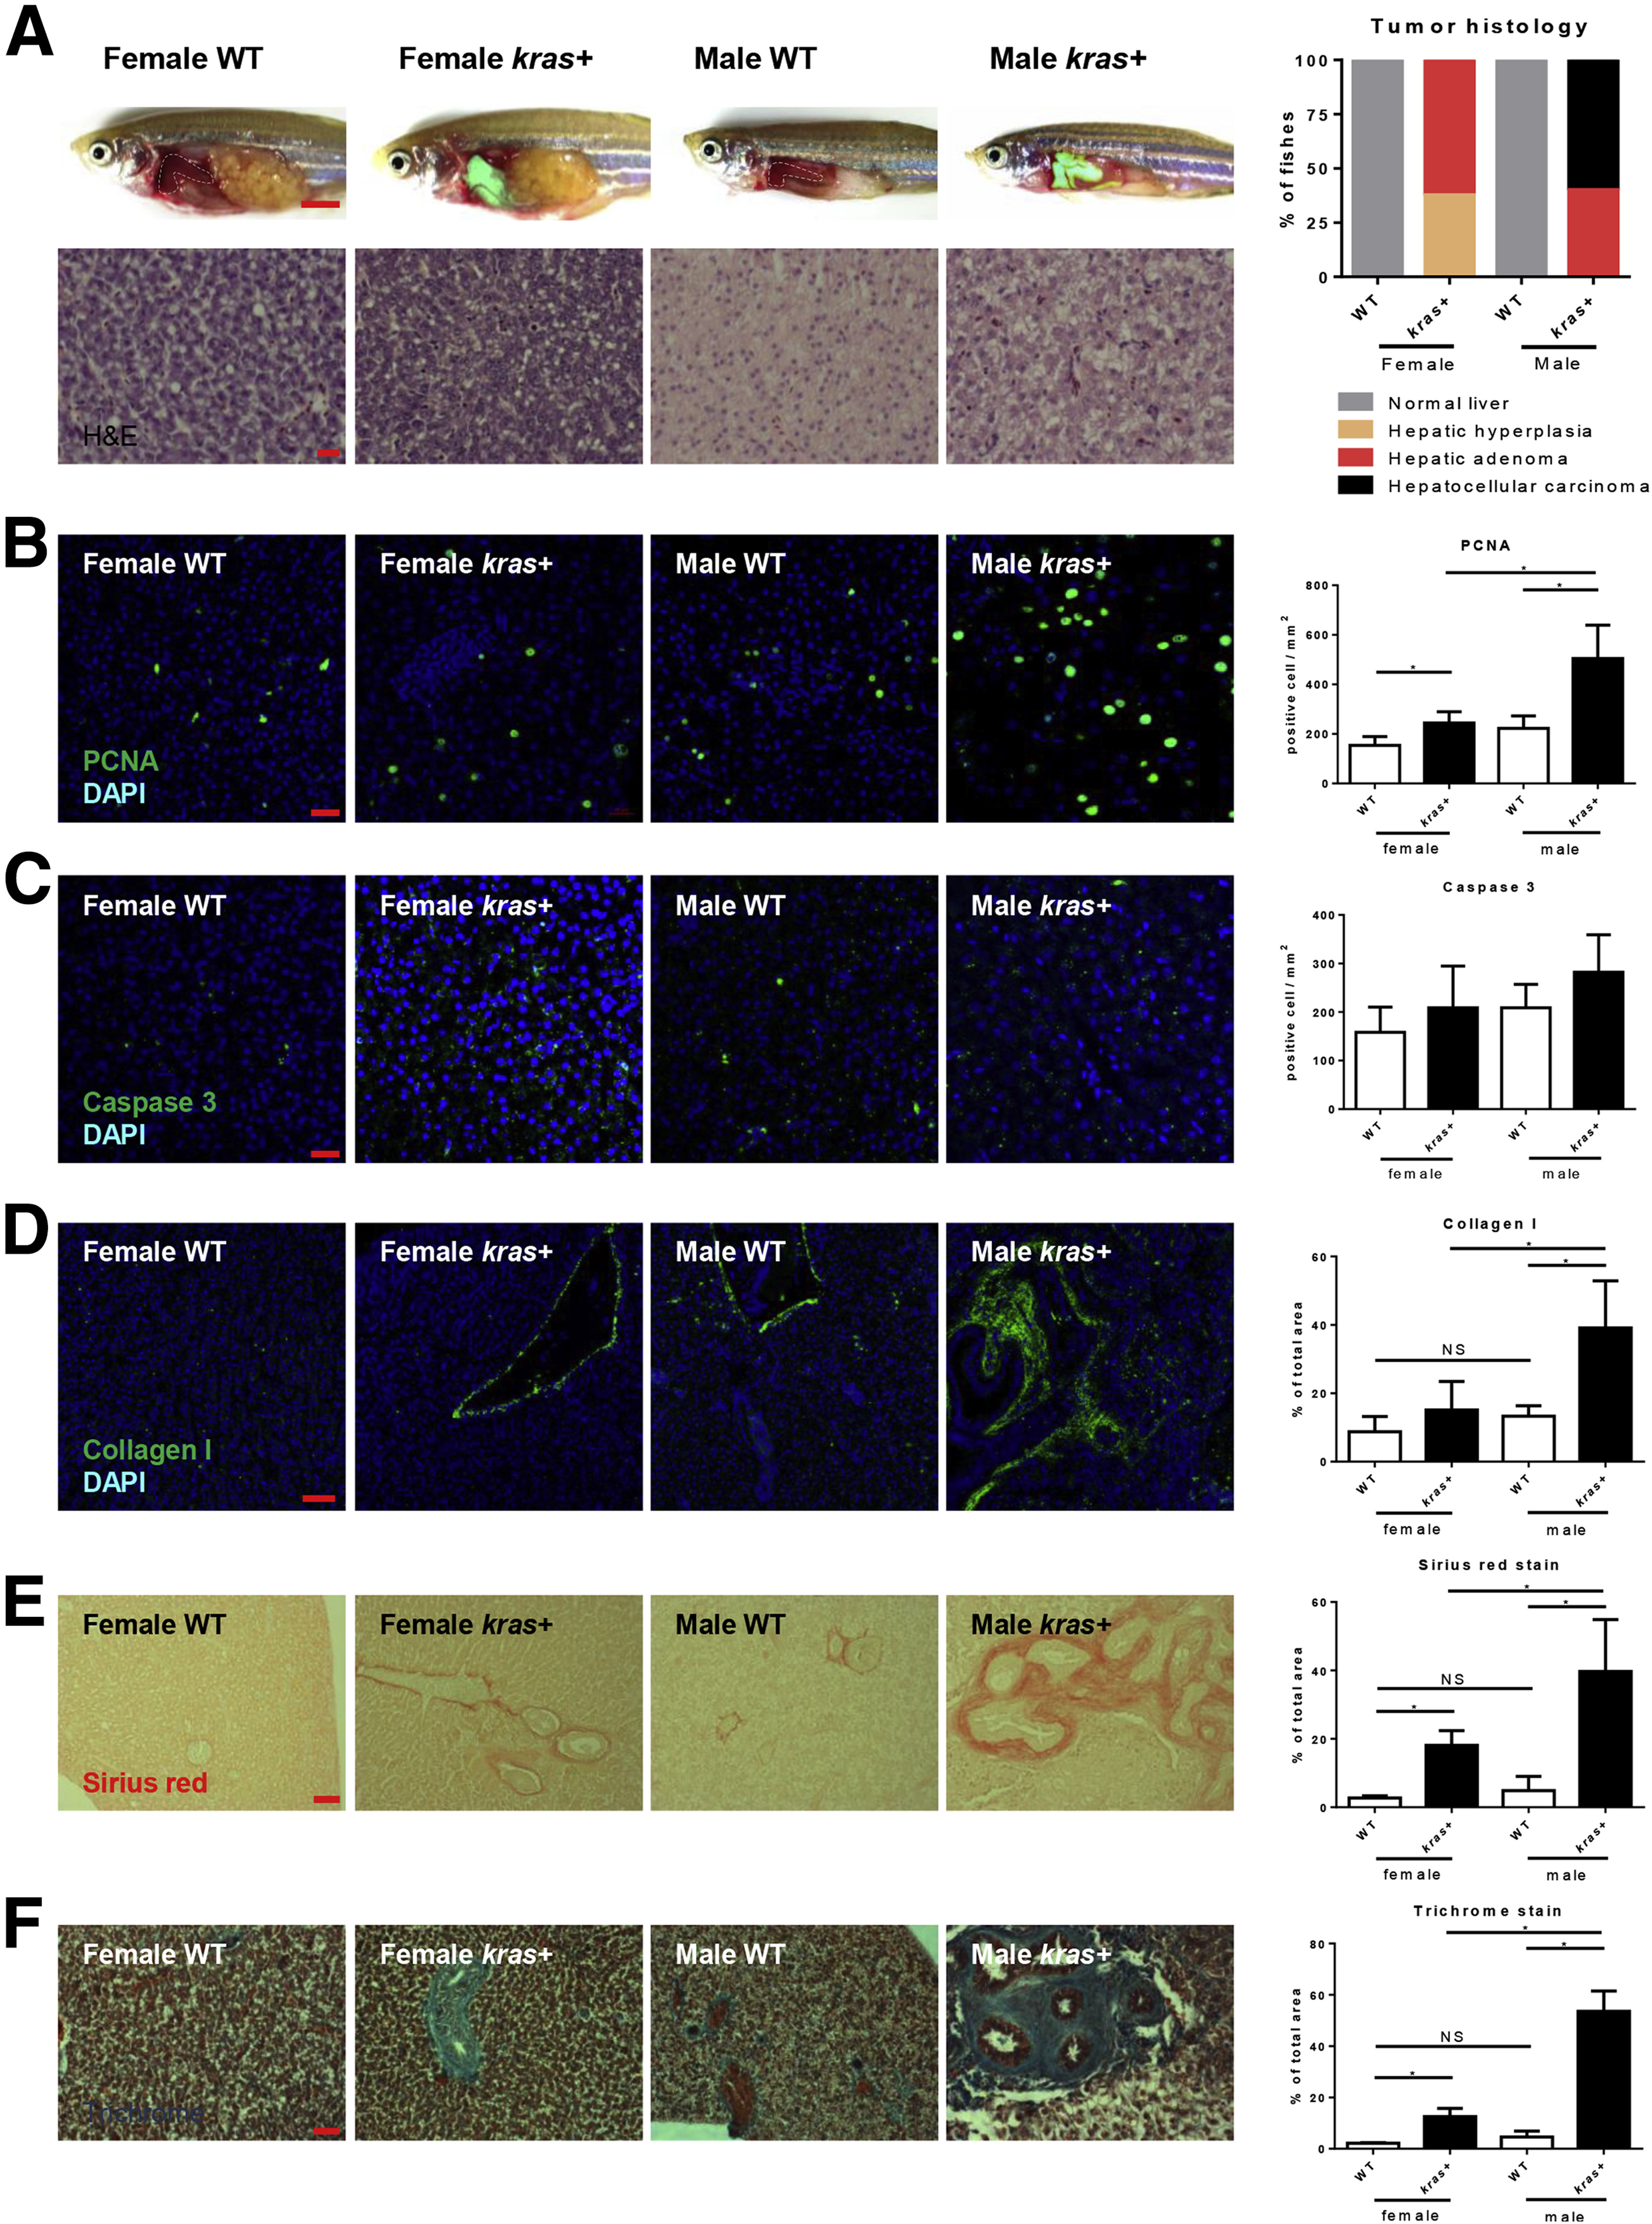
Sex disparity in krasV12-induced HCC progression. Three-month-old adult zebrafish were treated with 30 μg/mL dox for 7 days and examined by various assays as described in the text. (A) Gross morphology and histology of kras+ and WT (control) male and female zebrafish after dox exposure. Male krasV12-expressing liver (green for green fluorescent protein expression) were enlarged significantly as compared with female krasV12-expressing liver and also with WT male and female livers (dotted line enclosed). Bottom left: H&E staining of the liver sections of dox-treated kras+ and WT (control) male and female zebrafish. Right: Quantification of tumor histology observed in the H&E-stained liver sections of dox-treated kras+ male and female zebrafish is shown (n = 10 each group). (B–D) IF staining of (B) PCNA, (C) caspase 3, and (D) collagen I in liver sections of dox-treated kras+ and WT male and female zebrafish. Quantifications of stained cells are shown on the right (n > 8 in each group). (E) Picrosirius Red staining of the liver sections of dox-treated kras+ and WT male and female zebrafish. Quantification of fibrotic liver tissue area in Picrosirius Red–stained liver sections is shown on the right (n > 10 in each group). (F) Gomori’s trichrome staining of the liver sections of dox-treated kras+ and WT male and female zebrafish. Quantification of fibrotic liver tissue area in Gomori’s trichrome–stained liver sections is shown on the right (n > 8 in each group). *P < .05. Scale bars: (A) 3 mm (top row), 20 μm (bottom row), (E–F) 500 μm, (D) 50 μm, and (B and C) 20 μm. DAPI,4',6-diamidino-2-phenylindole.