
Fig. 6
- ID
- ZDB-IMAGE-180105-6
- Antibodies
- Publication
- Yang et al., 2017 - Serotonin Activated Hepatic Stellate Cells Contribute to Sex Disparity in Hepatocellular Carcinoma
- All Figures
- Figures for Yang et al., 2017
|
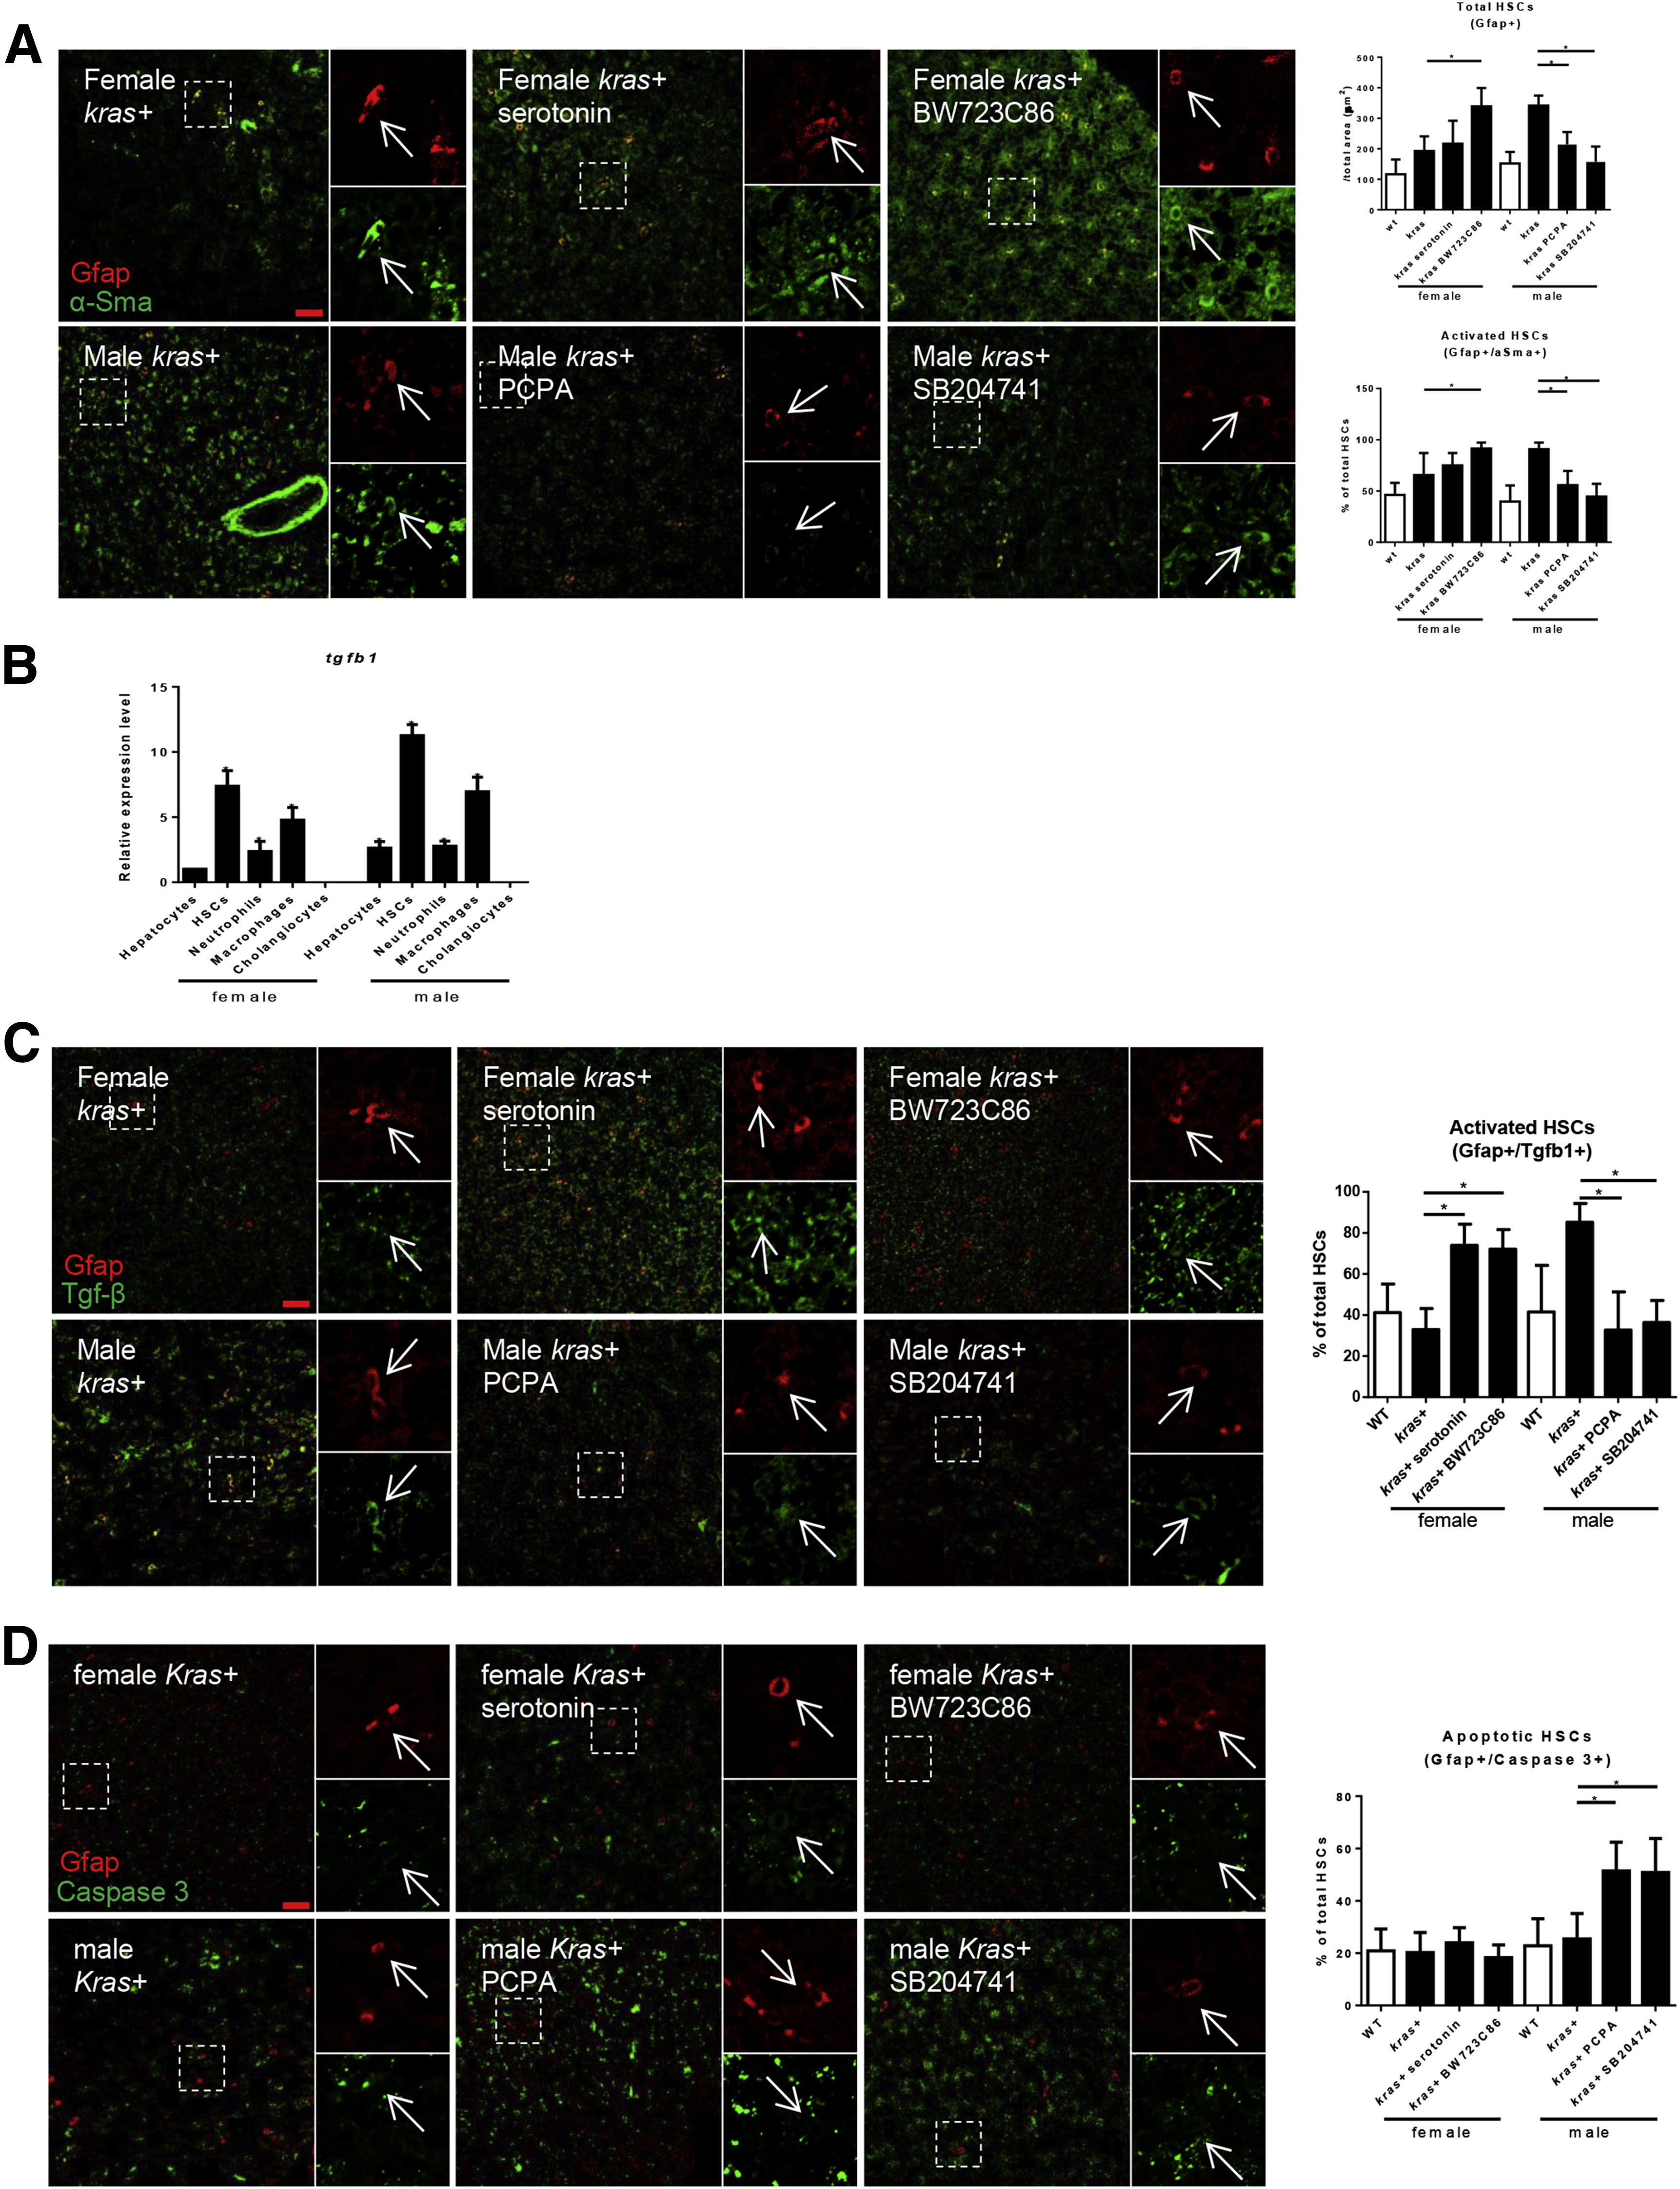
Fig. 6
Manipulation of serotonin level and HSC density affects HSC activation and apoptosis. (A) IF staining and quantification of HSC density (Gfap+) in liver sections (n > 8 in each group). Three-month-old adult zebrafish were treated with dox with or without serotonin, BW23C86, PCPA, and SB204741 for 7 days. Percentages of activated HSCs (Gfap+/α-Sma+) in the liver sections (n > 8 in each group). (B) Expression of tgfb1 in hepatocytes, HSCs, neutrophils, macrophages, and cholangiocytes. These cells were isolated by fluorescence-activated cell sorting based on DsRed, GFP, DsRed, mCherry, and GFP expression, respectively, from fabp10+, hand2+, lyz+, mpeg+, and tp1+ transgenic zebrafish. Total RNAs were extracted and htr2b expression was determined by reverse-transcription quantitative PCR. Relative expression levels are with the values with female hepatocytes set as 1. (C and D) IF staining and quantification of percentages of (C) TgfB1+ HSCs (Gfap+/Tgfb1+) and (D) apoptotic HSCs in the liver sections as described in panel A. n > 8 in each group. *P < .05. Scale bar: 20 μm.