
- Title
-
Histone demethylases Kdm6ba and Kdm6bb redundantly promote cardiomyocyte proliferation during zebrafish heart ventricle maturation
- Authors
- Akerberg, A.A., Henner, A., Stewart, S., Stankunas, K.
- Source
- Full text @ Dev. Biol.
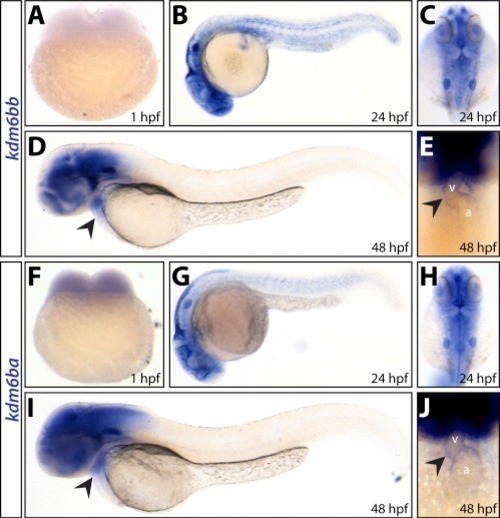
kdm6ba and kdm6bb have broad and largely overlapping developmental expression patterns. (A-J) Whole mount in situ hybridization for kdm6bb (A-E) and kdm6ba (F-J) transcripts on 1 hpf (A and F), 24 hpf (B, C, G, H) and 48 hpf (D, E, I, J) embryos. Arrowheads denote cardiac expression. Abbreviations: a, atrium; v, ventricle. |
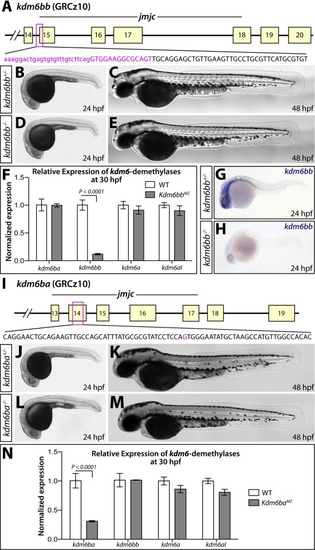
Generation and characterization of kdm6b loss of function alleles. (A) Schematic showing the deleted sequence in the kdm6bb mutant allele recovered from CRISPR/Cas9 targeted mutagenesis (magenta bases). (B-E) Whole mount differential interference contrast (DIC) microscopy images of 24 (B and D) and 48 hpf (C and E) embryos. (F) Bar graph showing relative kdm6bb transcript levels between wildtype and kdm6bbMZ embryos at 30 hpf determined by qRT-PCR on cDNA from three separate pools of ten embryos each. (G, H) In situ hybridization for kdm6bb on control and kdm6bbMZ 24 hpf zebrafish embryos. (I) Schematic showing the CRISPR/Cas9-generated kdm6ba mutant allele. The deleted base is shown in magenta. (J-M) DIC images of control and kdm6baMZ embryos at 24 hpf (J and L) and 48 hpf (K and M). (N) Bar graphs comparing qRT-PCR-determined normalized expression levels of each H3K27me3 demethylase-encoding transcripts between 30 hpf wildtype and kdm6bbMZ embryos (three independent pools of ten embryos each). Error bars in the bar graphs (F, N) show one standard deviation. P-values indicate a significant difference determined by Student's two-tailed t-tests after applying a Bonferroni correction for multiple comparisons. |
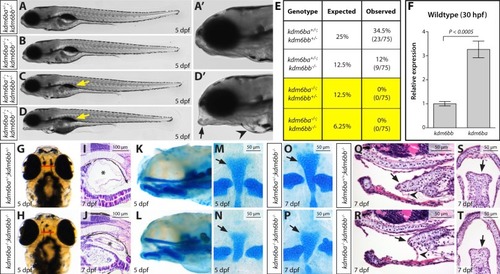
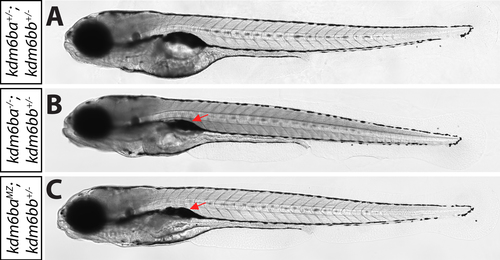
Combined genetic deficiency of kdm6ba and kdm6bb causes pleiotropic larval development defects. (A-D) Whole mount stitched DIC microscopy images of clutch mate 5 dpf larvae of the indicated genotypes. (A’ & D’) Zoomed anterior region of the control and kdm6ba-/-; kdm6bb-/- fish shown in A and D, respectively. Yellow arrows mark the absence of an inflated swim bladder. The black arrow and black arrowhead highlight the slack jaw and cardiac edema phenotypes, respectively, of a kdm6ba-/-; kdm6bb-/- larvae. (E) Viability table showing the expected versus observed adult genotype frequencies from kdm6ba+/-; kdm6bb+/- in-crosses. (F) Bar graph displaying relative kdm6ba and kdm6bb transcript levels in 30 hpf wildtype embryos. Data is normalized to rpl18 expression. P-value is from a Student's two-tailed t-test with error bars showing one standard deviation. (G, H) Whole mount dorsal view of 5 dpf control and clutch mate kdm6ba/kdm6bb-deficient larvae. (I, J) H&E-stained sagittal sections through 7 dpf larvae centered on the swim bladder (asterisk). (K, L) Sagittal whole mount view of alcian blue stained 5 dpf larvae. (M-P) Flat mounts of alcian blue-stained 5 dpf (M, N) and 7 dpf (O, P) larvae of the indicated genotypes. Black arrows mark the basihyal cartilage. (Q-T) H&E-stained sagittal (Q, R) and coronal (S, T) midline sections through 7 dpf kdm6bb-null and kdm6ba/kdm6bb-double deficient larvae. Arrows indicate the basihyal cartilage and arrowheads point at the cartilage's associated ligament. 50 or 100 μm scale bars are shown. |
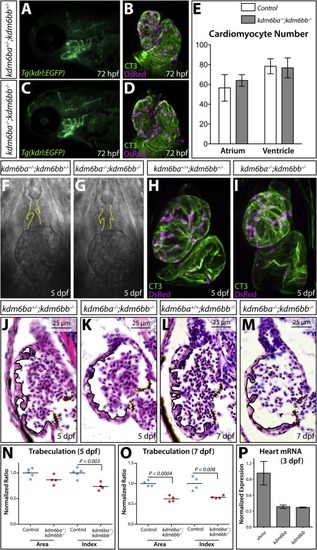
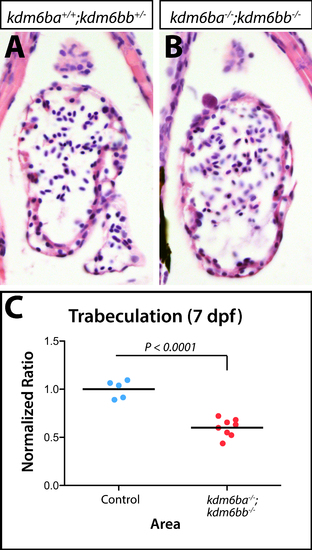
Kdm6ba and kdm6bb redundantly promote cardiac trabeculation. (A, C) Fluorescent imaged whole mount 72 hpf embryos showing the aortic arch arteries of control and kdm6b-deficient Tg(kdrl:EGFP) animals. (B, D) Confocal heart images of whole mount 72 hpf Tg(myl7:DsRed-nuc)larvae antibody stained for DsRed (red, cardiomyocyte nuclei) and cardiac troponin (CT3, heart muscle). Control and combined kdm6ba/kdm6bb-deficient larvae are shown. (E) Bar graphs comparing the absolute number of atrial and ventricular cardiomyocytes between 72 hpf control (kdm6ba+/-; kdm6bb+/- and kdm6ba+/+; kdm6bb+/-) and kdm6ba-/-; kdm6bb-/- larvae. Error bars represent one standard deviation (n=6 control and 7 kdm6ba/bb-deficient fish from two clutches). (F, G) DIC microscopy images showing the OFT and ventricle of control and kdm6b-deficient embryos at 5 dpf. Dashed yellow lines outline the OFT valves. (H, I) Whole mount confocal imaged hearts of immunostained 5 dpf control and kdm6ba-/-; kdm6bb-/- larvae. These Tg(myl7:DsRed-nuc) fish are stained with anti-DsRed (red, cardiomyocyte nuclei) and anti-cardiac troponin (CT3, green) antibodies. (J-M) H&E stained sagittal sections through the heart of 5 and 7 dpf control and kdm6ba-/-; kdm6bb-/- larvae. Solid lines outline the trabeculae and dashed yellow lines indicate the AVC valves. (N, O) Scatterplot graphs showing the normalized outer curvature ventricular sectional area and trabeculation extent (“index”) of 5 and 7 dpf control compared to clutch mate kdm6ba-/-; kdm6bb-/- larvae. Each data point represents one animal. P-values are from Student's two-tailed t-tests. (P) Bar graph of qRT-PCR data comparing kdm6ba and kdm6bb to vmhcl transcript levels using three pools of isolated 3 dpf zebrafish embryonic hearts (normalized to vmhcl levels). Error bars are one standard deviation. EXPRESSION / LABELING:
PHENOTYPE:
|
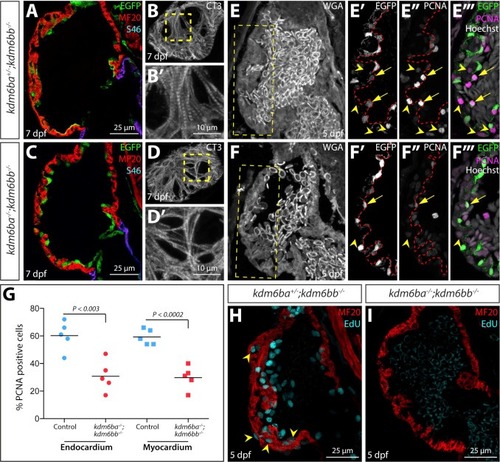
Kdm6b proteins enable coordinated endocardial and myocardial proliferation associated with early stage ventricle maturation. (A-C) Confocal immunofluorescence images of sagittal heart sections from 5 dpf kdm6b- and kdm6a/kdm6b-deficient Tg(kdrl:EGFP) larvae stained with anti-GFP (green, endocardium), anti-myosin heavy chain (MF20, red, myocardium), and anti-S46 (magenta, atrial muscle) antibodies. (B, D) Cardiac troponin (CT3) antibody staining of superficial sections through the heart of 5 dpf kdm6bb-/- and kdm6ba-/-; kdm6bb-/- larvae. B’ and D’ are zoomed images of the dashed yellow box regions. (E-F) Confocal imaged sagittal sections of 5 dpf control and combined kdm6b-deficient Tg(kdrl:EGFP) embryos stained with wheat germ agglutinin (WGA, grey) as well as anti-GFP (green in overlay panels, endocardium) and anti-PCNA (magenta in overlay panels) antibodies. Yellow boxes in E and F indicate zoomed regions shown in E’-F’’’. Arrows and arrowheads mark PCNA-positive endocardial and myocardial cells, respectively. (G) Scatterplot graphs showing the number of PCNA positive endocardial and myocardial cells within the outer curvature ventricular wall scored from matched sagittal heart sections of 5 dpf control and kdm6ba-/-; kdm6bb-/- larvae. Each point represents a distinct fish. P-values are from two-tailed Student's t-tests. (H, I) Confocal heart images of sagittal sectioned 5 dpf control and kdm6a/kdm6b-deficient larvae stained for EdU incorporation (cyan, proliferating cells) and with anti-myosin heavy chain antibody (red, MF20, cardiomyocytes). |
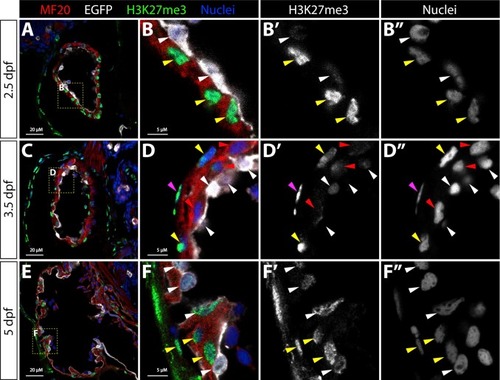
Bulk cellular H3K27me3 levels transiently decrease in trabeculating cardiomyocytes. (A-F) Confocal microscopy immunofluorescence images of sagittal sections through the heart of 2.5, 3.5, and 5 dpf Tg(kdrl:EGFP) embryos stained with anti-myosin heavy chain (red, MF20, myocardium), anti-EGFP (white, endocardium), and anti-H3K27me3 (green) antibodies. Hoechst-stained nuclei are blue. Zoomed images of the yellow boxed areas (in A, C, and E) are shown in (B, D, and F) with adjacent single channel H3K27me3 and nuclei staining to highlight differences in bulk H3K27me3 levels. Magenta and white arrowheads indicate nuclei of epicardial and endocardial cells, respectively. Yellow and red arrowheads mark H3K27me3-high and H3K27me3-low cardiomyocyte nuclei, respectively. 20 μM and 5 μM (zoom panels) scale bars are shown. |

ZFIN is incorporating published figure images and captions as part of an ongoing project. Figures from some publications have not yet been curated, or are not available for display because of copyright restrictions. PHENOTYPE:
|
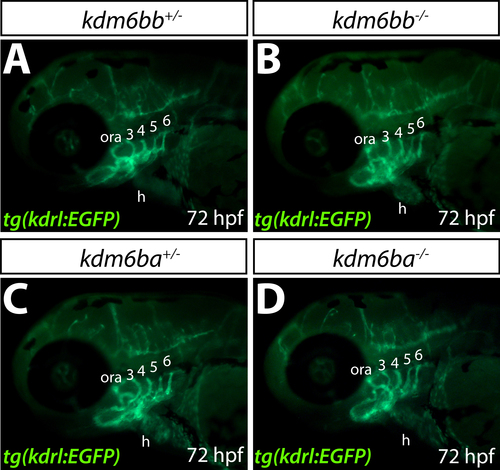
Aortic artery organization is unperturbed in kdm6bb-/- and kdm6ba-/- zebrafish. |
kdm6b-deficient zebrafish complete embryonic development without overt defects. |
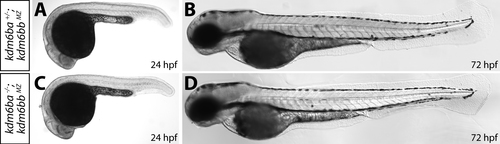
Depletion of maternal and zygotic kdm6ba/kdm6bb transcripts does not affect early embryonic development. |
Decreased ventricular area in coronal sections of 7 dpf kdm6b-deficient embryos. |
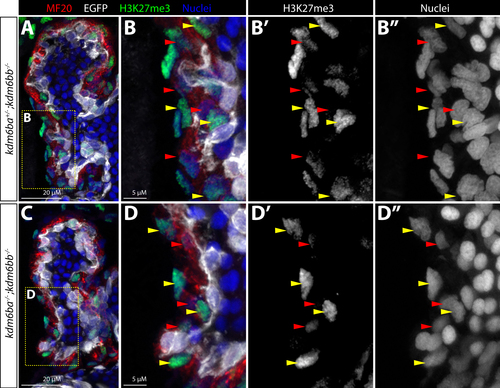
kdm6ba/bb are not required for the transient depletion of bulk H3K27me3 levels in trabeculating cardiomyocytes. (A-D”) Confocal microscopy immunofluorescence images of sections through the hearts of 3 dpf Tg(kdrl:EGFP) control and kdm6ba/bb-deficient embryos stained with antimyosin heavy chain (red, MF20, myocardium), anti-EGFP (white, endocardium), and anti-H3K27me3 (green) antibodies with Hoechst-stained nuclei in blue (A, B, C, D). Yellow boxed areas in A and C are shown zoomed in B-B” and D-D” respectively with grey-scale single channel images of H3K27me3 staining (B’, D’) and nuclei (B”, D”). Arrowheads indicate myocardial cells with robust (yellow) or depleted (red) bulk H3K27me3 levels. 20 μM and 5 μM scale bars are shown |
Reprinted from Developmental Biology, 426(1), Akerberg, A.A., Henner, A., Stewart, S., Stankunas, K., Histone demethylases Kdm6ba and Kdm6bb redundantly promote cardiomyocyte proliferation during zebrafish heart ventricle maturation, 84-96, Copyright (2017) with permission from Elsevier. Full text @ Dev. Biol.