- Title
-
Atrogin-1 Deficiency Leads to Myopathy and Heart Failure in Zebrafish
- Authors
- Bühler, A., Kustermann, M., Bummer, T., Rottbauer, W., Sandri, M., Just, S.
- Source
- Full text @ Int. J. Mol. Sci.
|
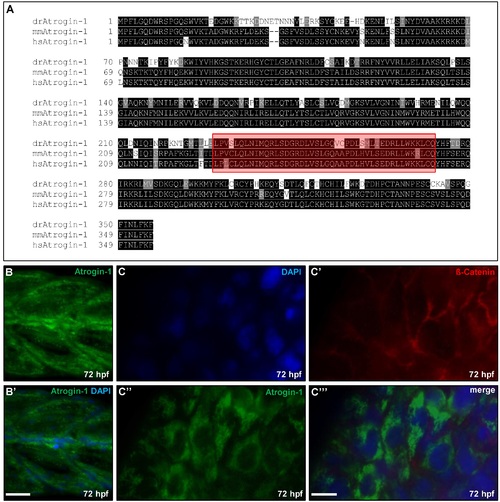
Atrogin-1 is conserved between humans, mice, and zebrafish and zebrafish Atrogin-1 is expressed in the embryonic skeletal muscle and heart. (A) Protein alignment of Danio rerio (dr), Mus musculus (mm) and Homo sapiens (hs) Atrogin-1, identical amino acids are shaded in black, similar amino acids in grey. Conserved F-box domain is depicted in red; (B,B′) Immunofluorescent staining against Atrogin-1 on paraffin sections of zebrafish skeletal muscle at 72 hpf, nuclei are counterstained with DAPI, scale bar = 25 µm; (C-C′′′) Immunofluorescent staining against Atrogin-1 (green) and β-Catenin (red) on dissected zebrafish hearts at 72 hpf, nuclei are counterstained with DAPI, scale bar = 10 µm. EXPRESSION / LABELING:
|
|
Knock-down of Atrogin-1 leads to defects in muscle and heart morphology. (A,B) Lateral view of embryos at 48 hpf injected either by 5 bp mismatch Start Morpholino (MO1-control, A) or Start Morpholino directed against atrogin-1 (MO1-atrogin-1, B); (A′,A′′-B′,B′′) Close-ups of heart and tail of injected embryos at 48 hpf; (C,D) Lateral view of embryos at 48 hpf either injected by a 5 bp mismatch Morpholino targeting a splice donor site of Atrogin-1 as a control (MO2-control) or a Splice Morpholino (MO2-atrogin-1); (E,F) Lateral view of embryos at 48 hpf. Control injection with atrogin-1 mRNA (E); Rescue of the morphant phenotype by injecting atrogin-1 mRNA and MO2-atrogin-1 together (F); (G) Statistical analysis of affected embryos after MO1/2-control, MO1/2-atrogin-1, atrogin-1 mRNA or MO2-atrogin-1 and atrogin-1 mRNA. Data represent means ± SD, student’s t-test, ** p-value < 0.0022; (H) Western Blot analysis using an Atrogin-1-specific antibody after MO1-control and MO1-atrogin-1 injection, RT-PCR after injection of MO2-control, or MO2-atrogin-1 showing specific effect of MO injection. Atrium (A) and ventricle (V). PHENOTYPE:
|
|
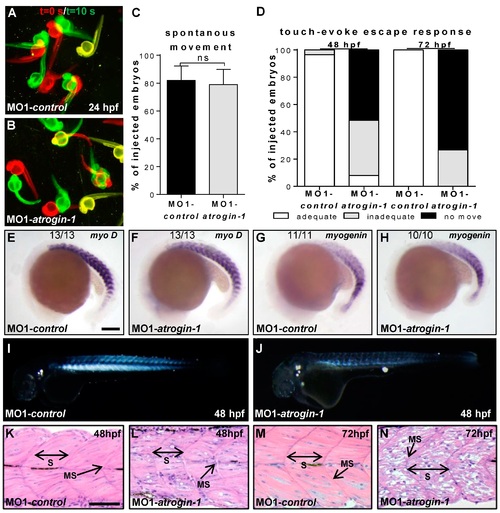
Myopathic phenotype in Atrogin-1 knock-down embryos is progressive. (A,B) Spontaneous movement assay with false-colored superimposed overviews of 24 hpf control (A) and Atrogin-1 morphants (B); red pictures = 0 s; green pictures = 10 s; yellow = merge; (C) Statistical analysis of spontaneous movement assay, data represent means ± SD, student’s t-test p-value < 0.27, ns = not significant; (D) Quantification of touch-evoke flight response of 48 hpf and 72 hpf MO1-control and MO1-atrogin-1 injected embryos; (E–H) Lateral view of whole-mount antisense RNA in situ hybridization against myoD at 18-somite stage (E,F) and against myogenin at the 16-somite stage (G,H) scale bar = 100 µm. Expression of MyoD and myogenin is unaltered in Atrogin-1 morphants; (I,J) Lateral view of MO1-control (I) and MO1-atrogin-1 injected embryos (J) showing birefringence at 48 hpf; (K–N) H&E-stained sagittal histological sections of skeletal muscle at 48 and 72 hpf. S = somite, MS = myoseptum, arrow indicate somite borders, scale bar = 50 µm. EXPRESSION / LABELING:
PHENOTYPE:
|
|
Impaired heart function in Atrogin-1-deficient embryos. (A) Fractional shortening (FS) measurements of the ventricular chambers of Atrogin-1 morphants and embryos injected with control Morpholino at 48 and 72 hpf; (B) Heart beat per minute of MO1-control compared to MO1-atrogin-1 injected embryos measured at 48 and 72 hpf. Data represent means ± SD, student´s t-test, *** p< 0.0001 (A,B); (C-F) Whole-mount antisense RNA in situ hybridization against atrial myosin heavy chain (amhc) and ventricular myosin heavy chain (vmhc) demonstrates unaltered mRNA expression in Atrogin-1 morphants at 48 hpf, scale bar = 50 µm; (G,H) H&E-stained sagittal histological sections shows normal heart morphology in MO1-control and MO1-atrogin-1 morphant hearts at 72 hpf. Atrium (A), ventricle (V), myocardium (Myo), atrio-ventricular canal (AVC) and outflow tract (OFT), scale bar = 50 µm. EXPRESSION / LABELING:
PHENOTYPE:
|
|
Atrogin-1 deficiency results in an accumulation of p62 and LC3-II and blocks autophagy. (A,B) Representative Western Blots of protein levels of the autophagy markers LC3 (A) and p62 (B) in MO1-control and MO1-atrogin-1 injected embryos. Gray values were measured, quantified and data statistically evaluated (data represent means ± SD, student´s t-test, * p < 0.05) (A,B); (C,D) Western Blotting of ubiquitinated proteins in protein lysates of control injected embryos compared to Atrogin-1-deficient embryos (C) and Atrogin-1 morphants with or without treatment with the UPS inhibitor MG132 (D); (E) Western Blot analysis of MO1-control and MO1-atrogin-1 injected embryos, DMSO or NH4Cl incubated for 12 h. Significant increase in MO1-control treated embryos compared to DMSO control, whereas no alteration was observed in MO1-atrogin-1 morphants, data represent means ± SD, student´s t-test, * p < 0.05, ns = not significant; (F) Western Blot analysis of Bafilomycin A1 treated embryos. PHENOTYPE:
|
|
Atrogin-1 deficiency leads to an autophagy-related ultrastructural muscle pathology. (A-D) Electron micrographs of cardiomyocytes (heart) and skeletal muscle cells (skm) of Atrogin-1 morphants and embryos injected with control Morpholino at 72 hpf. Asterisks indicate vesicular bodies, arrowhead indicates dysmorphic mitochondria, scale bar = 2 µm. PHENOTYPE:
|
|
(A) RT-PCR for atrogin-1 and β-actin on wild-type on zebrafish cDNA from 12-Somite stage (S) until 72 hpf; (B) Western blot analysis using an anti-Myc antibody after atrogin-1 mRNA and MO2-atrogin-1 + atrogin-1 mRNA injection; (C) Immunoblot analysis using an anti-Atrogin-1 antibody after MO1-control and MO2-atrogin-1 injection; (D,E) Lateral views of control injected (D) and MO1-atrogin-1 injected embryos (E) showing birefringence at 72 hpf; (F-I) Electron micrographs of skeletal muscle cells (skm) of Atrogin-1 morphants (G,I) and embryos injected with control Morpholino (F,H) at 72 hpf. (J,J′) Immunofluorescent staining against Atrogin-1 on paraffin sections, in lateral view of wild-type embryo at 72 hpf, nuclei are counterstained with DAPI. EXPRESSION / LABELING:
PHENOTYPE:
|


