
Fig. 3
- ID
- ZDB-IMAGE-160316-15
- Genes
- Publication
- Bühler et al., 2016 - Atrogin-1 Deficiency Leads to Myopathy and Heart Failure in Zebrafish
- All Figures
- Figures for Bühler et al., 2016
|
Fig. 3
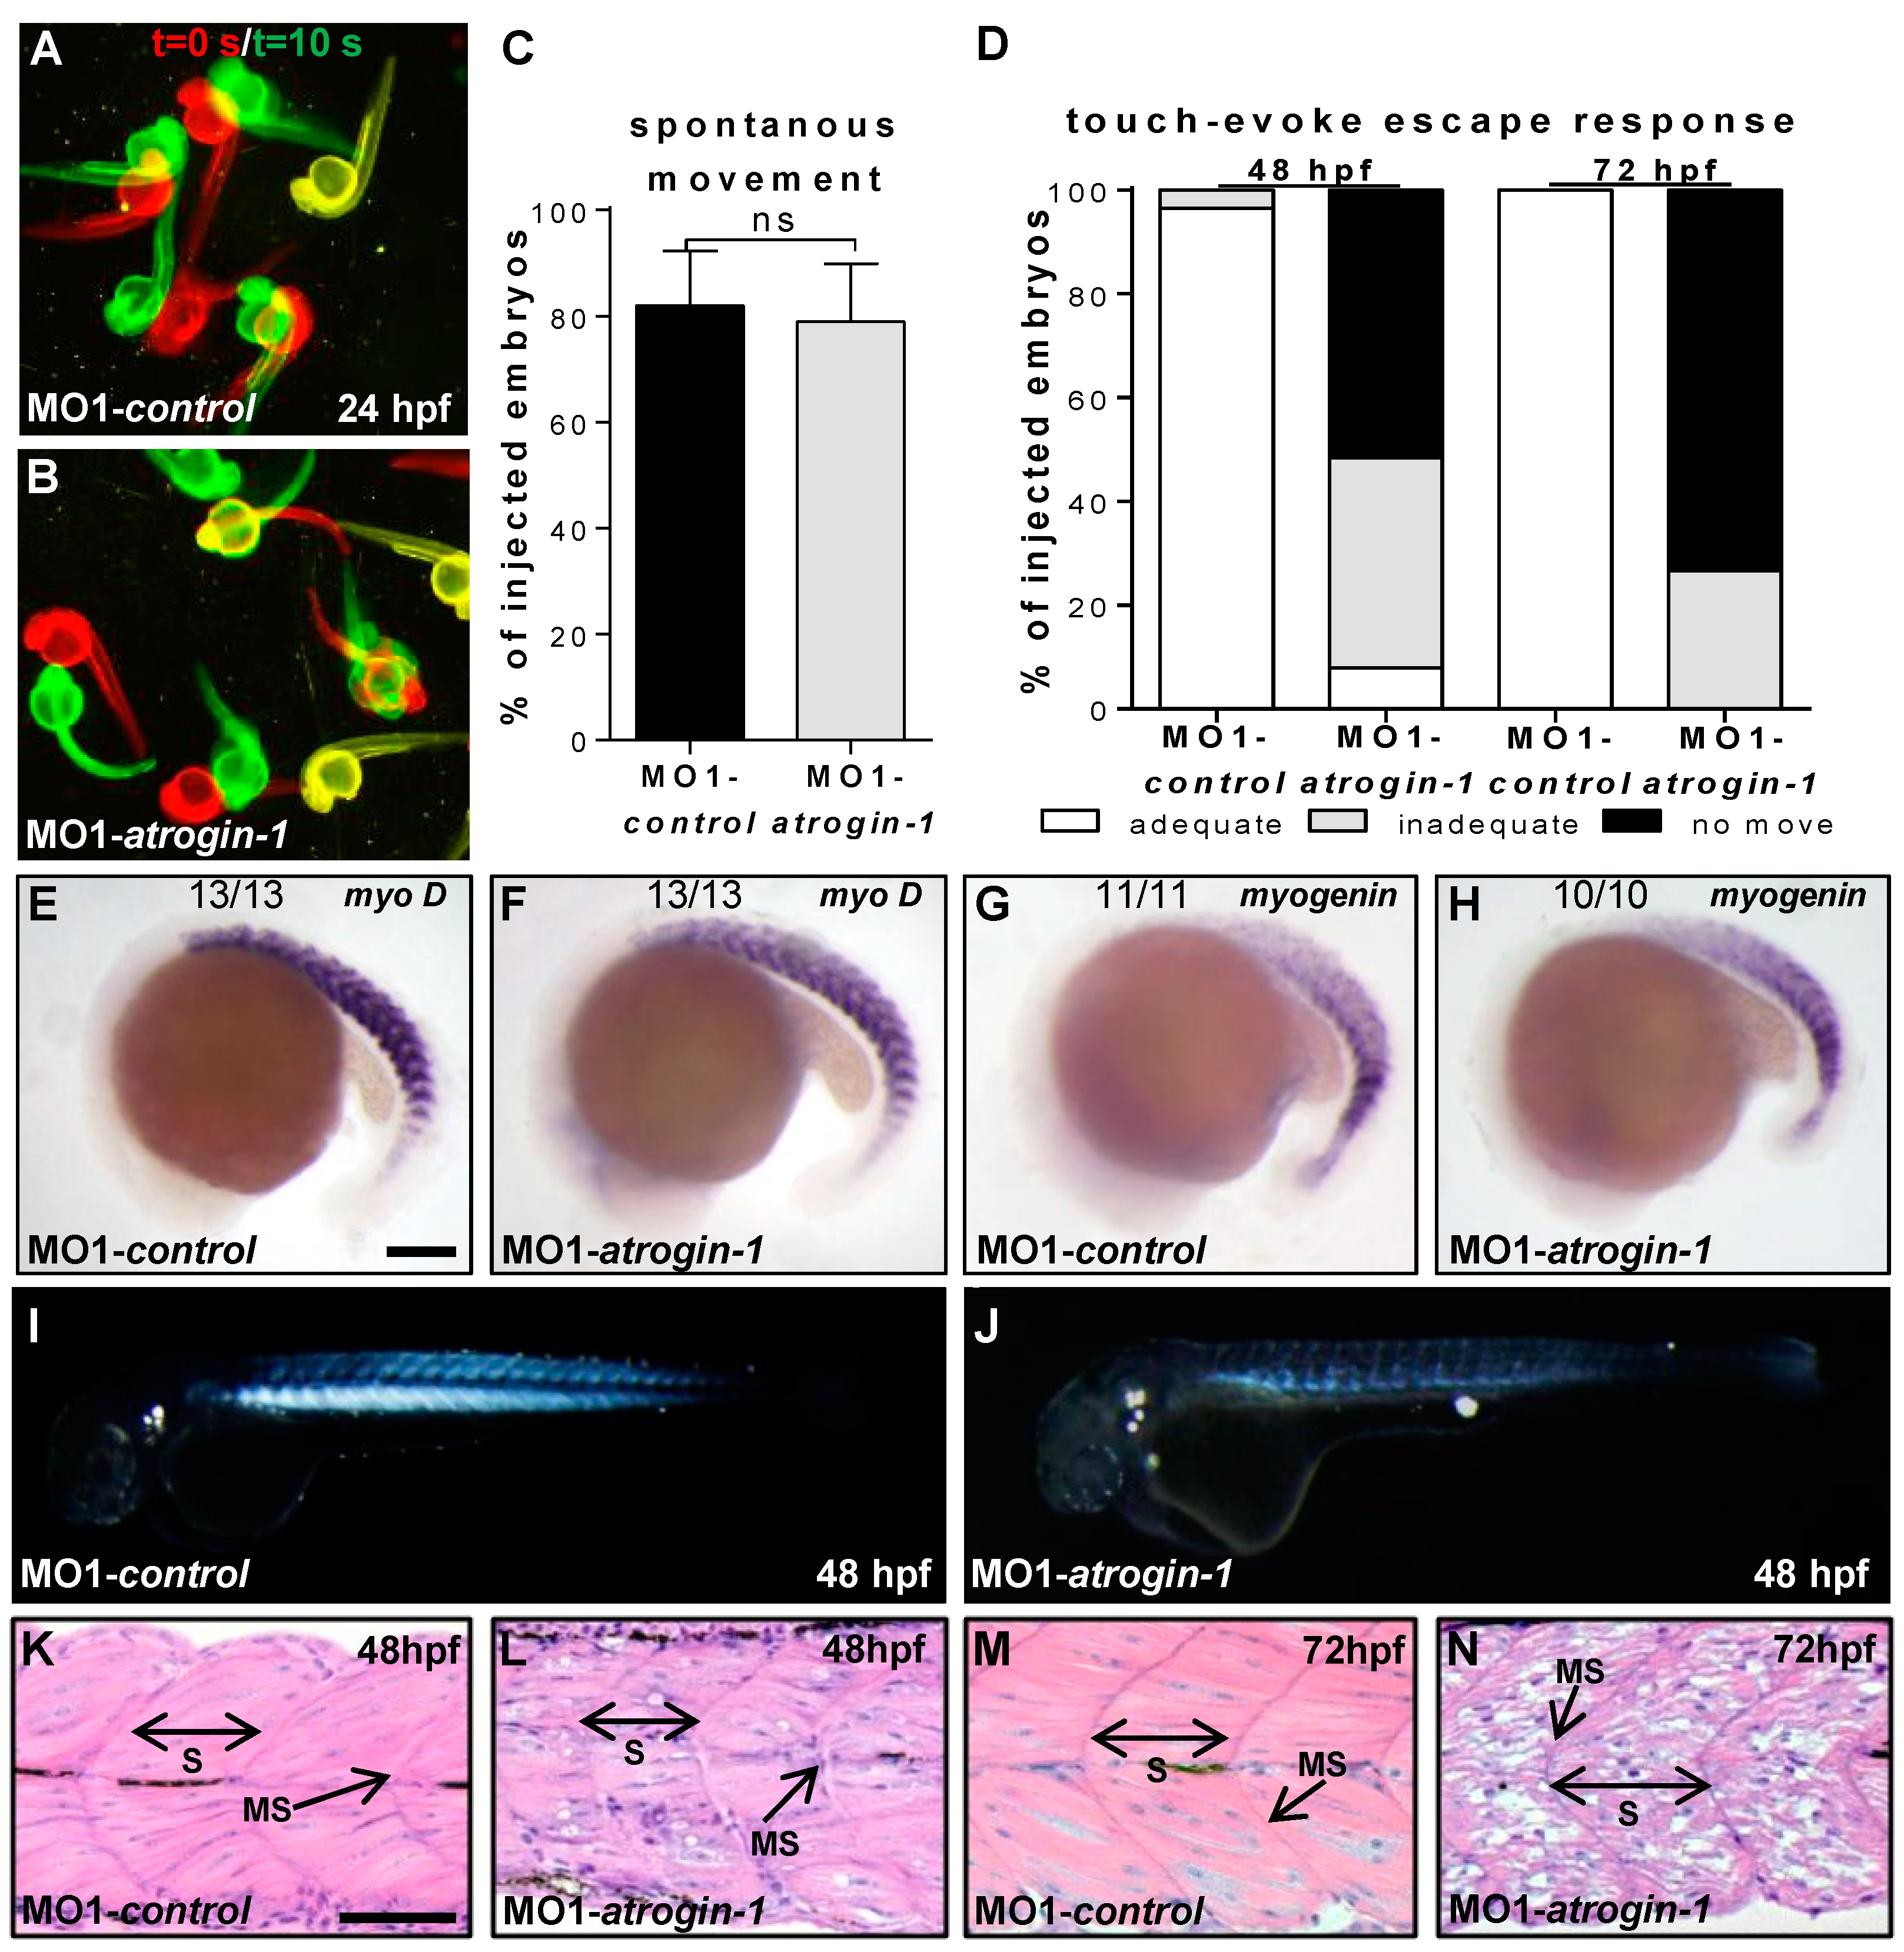
Myopathic phenotype in Atrogin-1 knock-down embryos is progressive. (A,B) Spontaneous movement assay with false-colored superimposed overviews of 24 hpf control (A) and Atrogin-1 morphants (B); red pictures = 0 s; green pictures = 10 s; yellow = merge; (C) Statistical analysis of spontaneous movement assay, data represent means ± SD, student’s t-test p-value < 0.27, ns = not significant; (D) Quantification of touch-evoke flight response of 48 hpf and 72 hpf MO1-control and MO1-atrogin-1 injected embryos; (E–H) Lateral view of whole-mount antisense RNA in situ hybridization against myoD at 18-somite stage (E,F) and against myogenin at the 16-somite stage (G,H) scale bar = 100 µm. Expression of MyoD and myogenin is unaltered in Atrogin-1 morphants; (I,J) Lateral view of MO1-control (I) and MO1-atrogin-1 injected embryos (J) showing birefringence at 48 hpf; (K–N) H&E-stained sagittal histological sections of skeletal muscle at 48 and 72 hpf. S = somite, MS = myoseptum, arrow indicate somite borders, scale bar = 50 µm.