
Fig. 5
- ID
- ZDB-IMAGE-161118-23
- Publication
- Bühler et al., 2016 - Atrogin-1 Deficiency Leads to Myopathy and Heart Failure in Zebrafish
- All Figures
- Figures for Bühler et al., 2016
|
Fig. 5
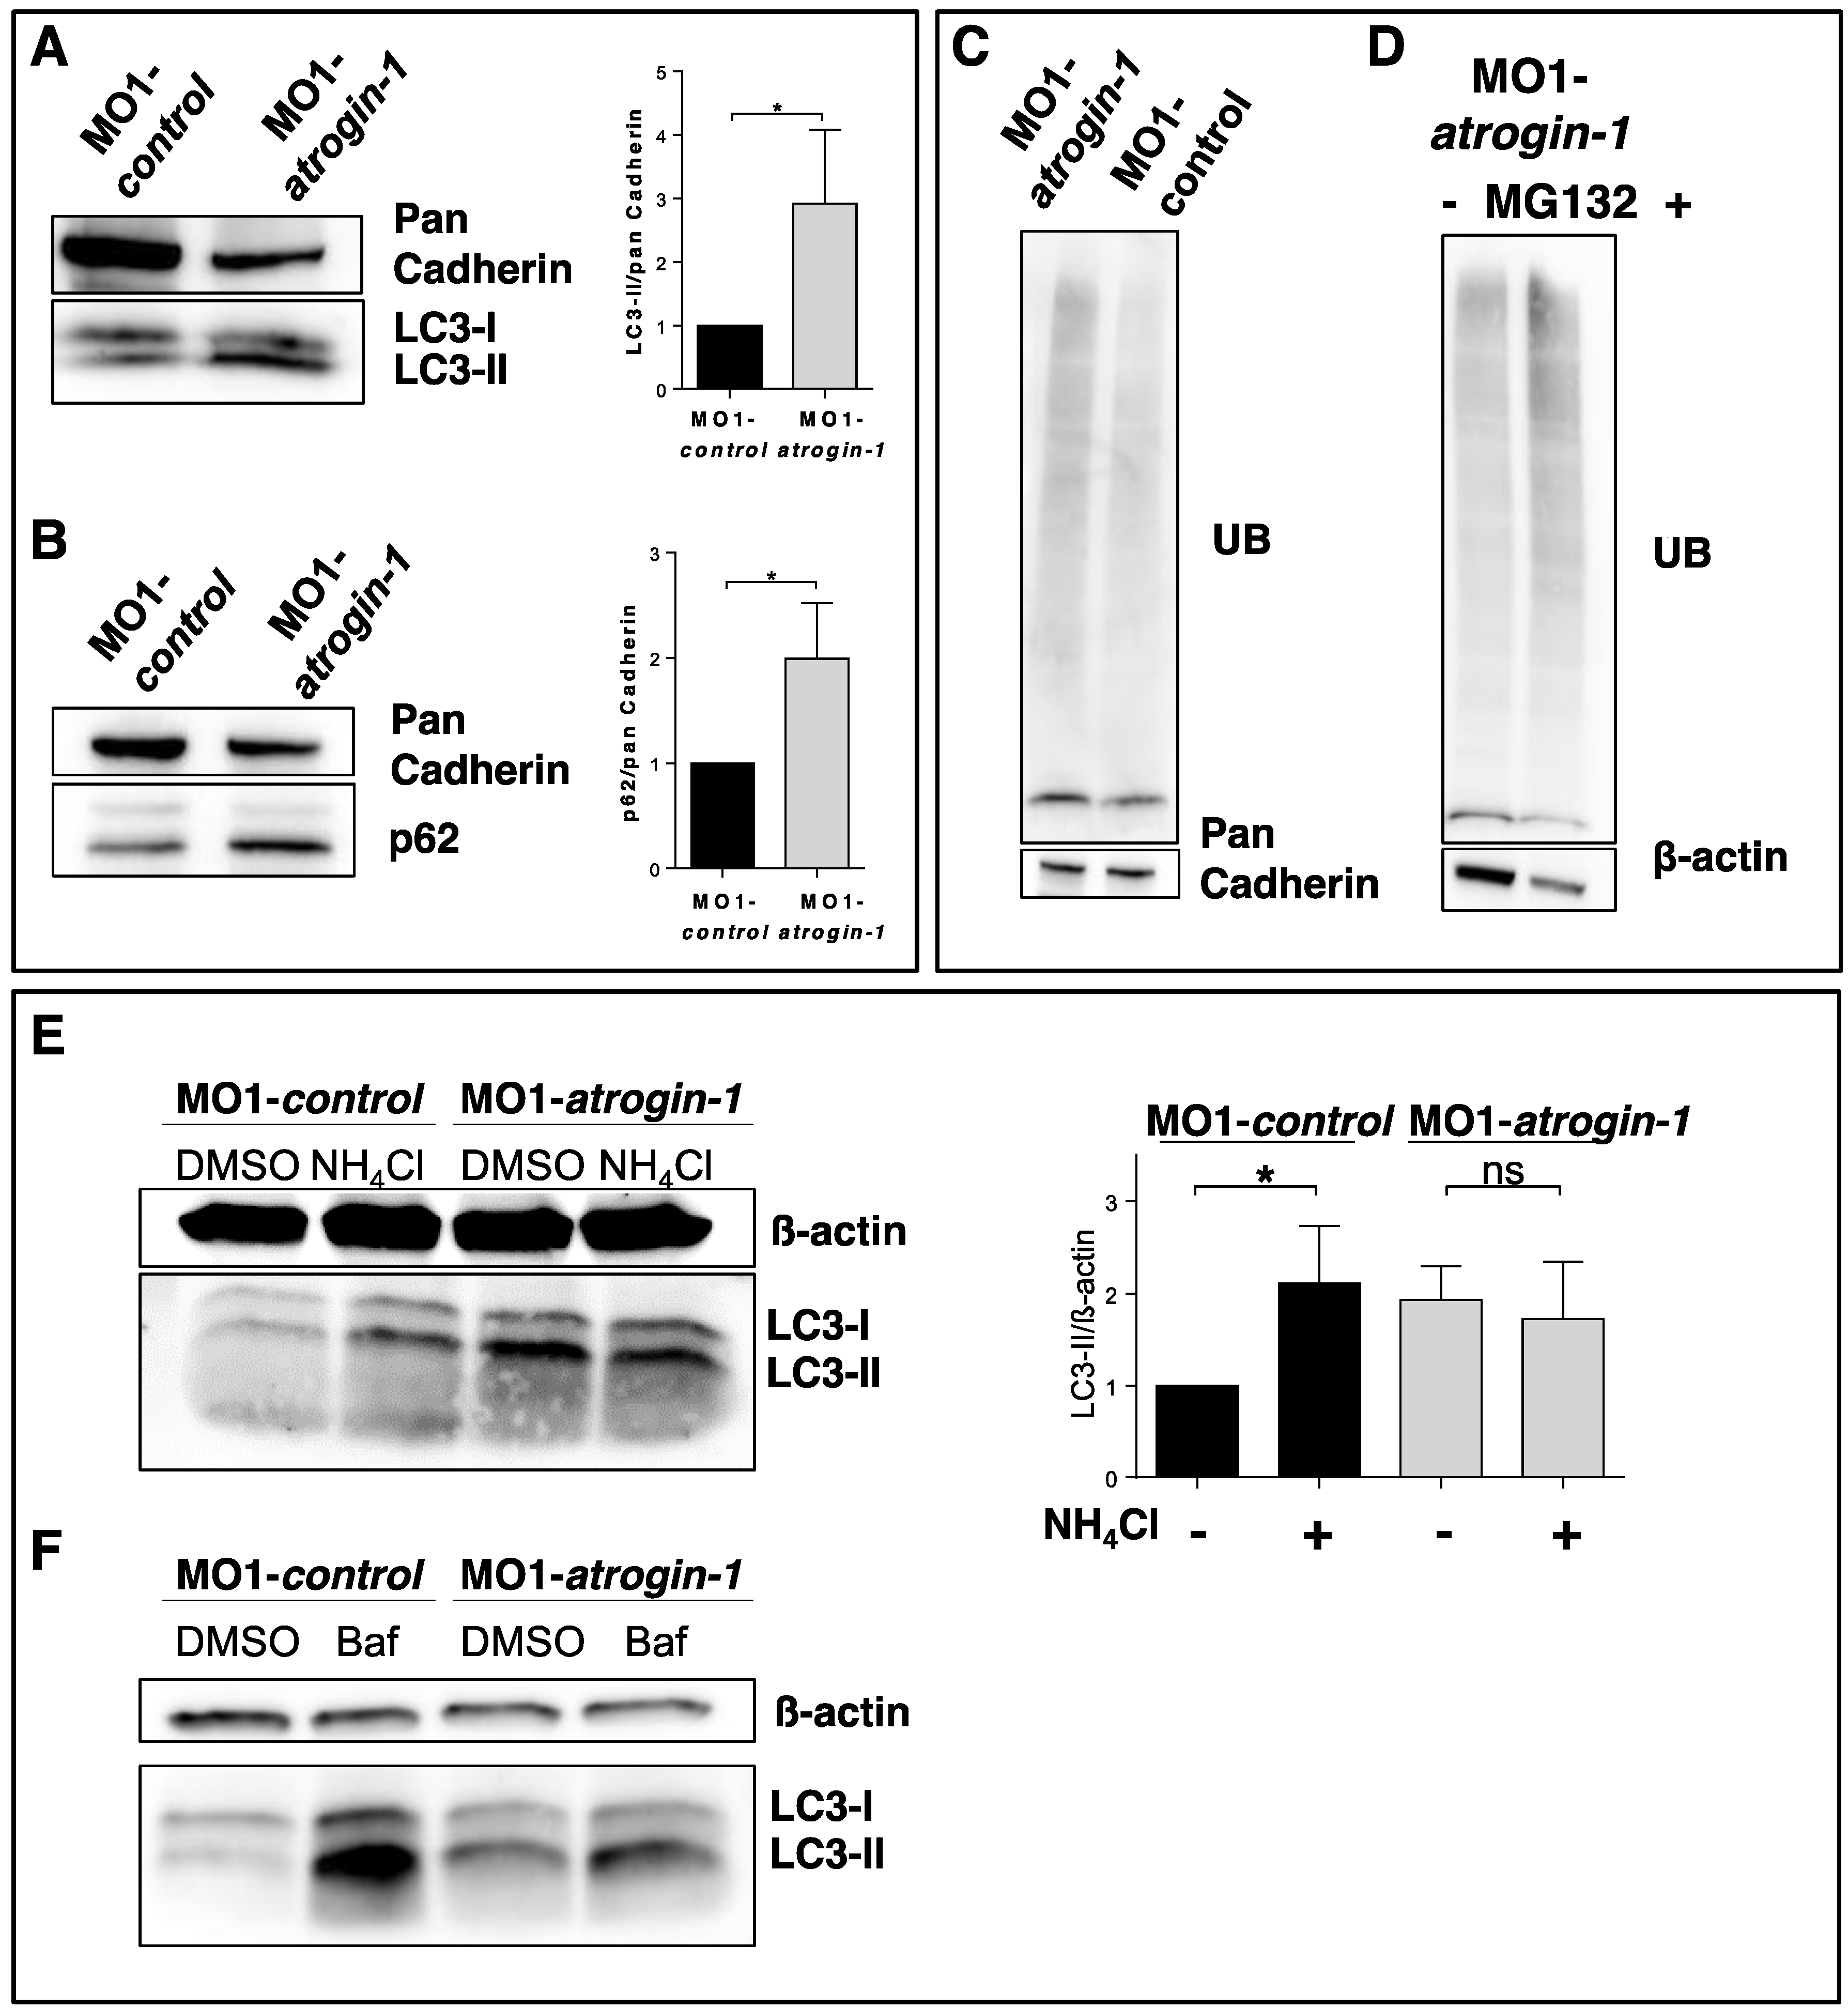
Atrogin-1 deficiency results in an accumulation of p62 and LC3-II and blocks autophagy. (A,B) Representative Western Blots of protein levels of the autophagy markers LC3 (A) and p62 (B) in MO1-control and MO1-atrogin-1 injected embryos. Gray values were measured, quantified and data statistically evaluated (data represent means ± SD, student´s t-test, * p < 0.05) (A,B); (C,D) Western Blotting of ubiquitinated proteins in protein lysates of control injected embryos compared to Atrogin-1-deficient embryos (C) and Atrogin-1 morphants with or without treatment with the UPS inhibitor MG132 (D); (E) Western Blot analysis of MO1-control and MO1-atrogin-1 injected embryos, DMSO or NH4Cl incubated for 12 h. Significant increase in MO1-control treated embryos compared to DMSO control, whereas no alteration was observed in MO1-atrogin-1 morphants, data represent means ± SD, student´s t-test, * p < 0.05, ns = not significant; (F) Western Blot analysis of Bafilomycin A1 treated embryos.