
- Title
-
G-quadruplexes as novel cis-elements controlling transcription during embryonic development
- Authors
- David, A.P., Margarit, E., Domizi, P., Banchio, C., Armas, P., Calcaterra, N.B.
- Source
- Full text @ Nucleic Acids Res.
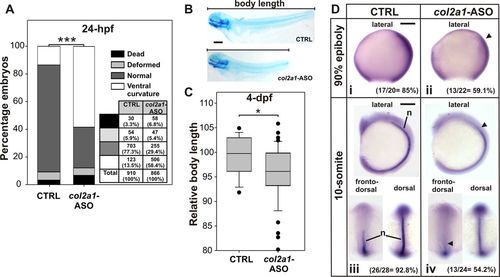
Effect of col2a1 G-quadruplex disruption by col2a1-ASO injection in zebrafish embryos. (A) Numbers and percentages of embryos showing dead, deformed, normal or ventral curvature phenotypes are shown in a table and represented in a stacked bar graph for 24-hpf staged embryos injected with CTRL or col2a1-ASO. ***P < 0.001, chi-square test. (B) Representative picture of 4-dpf staged larvae injected with CTRL or col2a1-ASO and stained with Alcian Blue to determine the body length. Lateral views, anterior to the left. (C) Box-plot of the relative body length of 4-dpf staged larvae injected with CTRL or col2a1-ASO. *P < 0.05, t-Student test. (D) WISH assessing the expression of col2a1 mRNA in 90% epiboly (i and ii) and 10-somite (iii and iv) staged embryos injected with CTRL (i and iii) or col2a1-ASO (ii and iv). Arrowheads point regions of lower expression. In lateral views anterior is to the left, and in dorsal and fronto-dorsal views anterior is up. Numbers and percentages of embryos/larvae with the shown phenotype are indicated in each panel. n: notochord. Scale bars (200 µm) are represented in B, Di and Diii. |
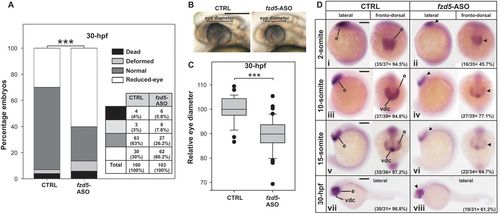
Effect of fzd5 G-quadruplex disruption by fzd5-ASO injection in zebrafish embryos. (A) Numbers and percentages of embryos showing dead, deformed, normal or reduced-eye phenotypes are shown in a table and represented in a stacked bar graph for 30-hpf staged embryos injected with CTRL or fzd5-ASO. ***P < 0.001, chi-square test. (B) Representative picture of 30-hpf staged embryos injected with CTRL or fzd5-ASO used to determine eye diameter. Lateral views, anterior to the left. (C) Box-plot of the relative eye diameter of 30-hpf staged embryos injected with CTRL or fzd5-ASO. ***P < 0.001, t-Student test. (D) WISH assessing the expression of fzd5 mRNA in 2-somite (i and ii), 10-somite (iii and iv), 15-somite (v and vi) and 30-hpf (vii and viii) staged embryos injected with CTRL (i, iii, v and vii) or fzd5-ASO (ii, iv, vi and viii). Arrowheads point regions of lower expression. In lateral views anterior is to the left, and in fronto-dorsal views anterior is up. Numbers and percentages of embryos/larvae with the shown phenotype are indicated in each panel. e: eye; vdc: ventral diencephalon. Scale bars (200 µm) are represented in B, Di, Diii, Dv and Dvii. |

Effect of nog3 G-quadruplex disruption by nog3-ASO injection in zebrafish embryos. (A) Numbers and percentages of embryos showing dead, deformed, normal or small head phenotypes are shown in a table and represented in a stacked bar graph for 48-hpf staged embryos injected with CTRL or nog3-ASO. ***P < 0.001, chi-square test. (B) Representative picture of Alcian Blue staining of craniofacial cartilages in 4-dpf staged larvae injected with CTRL or nog3-ASO. Ventral views, anterior to the left. (C) Box-plots of the relative ceratohyal cartilages angle and ceratobranchial cartilages number of 4-dpf staged larvae injected with CTRL or nog3-ASO. *P < 0.05, t-Student test. (D) WISH assessing the expression of nog3 mRNA in 56-hpf staged larvae injected with CTRL (i) or nog3-ASO (ii). Arrowheads point regions of lower expression. In lateral and dorsal views anterior is to the left. Numbers and percentages of embryos/larvae with the shown phenotype are indicated in each panel. ca: ceratohyal cartilages angle; cb (3-7): ceratobranchial cartilages 3 to 7; ch: ceratohyal cartilage; pa: pharyngeal arches; pf: pectoral fin; tc: trabeculae cranii. Scale bars (200 µm) are represented in B and Di. |
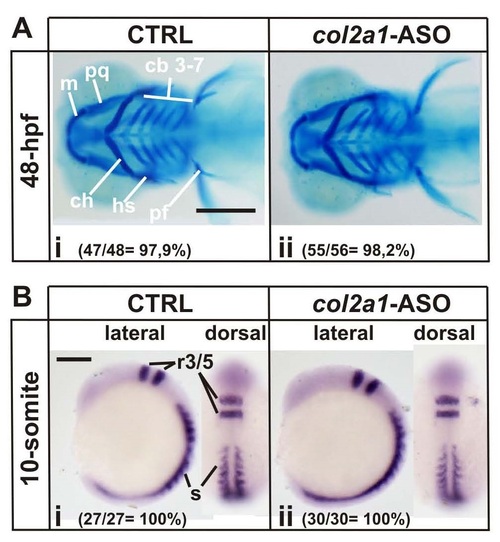
Analysis of cartilage pattern and myoD/krox20 expression pattern in col2a1- ASO injected embryos. A. Alcian blue staining of craniofacial cartilage in 4-dpf staged larvae injected with CTRL (i) or col2a1-ASO (ii). Ventral views, anterior to the left. B. WISH assessing the expression of myoD mRNA as a marker of somites and krox20 (erg2) mRNA as a marker of rhombomeres 3 and 5 in 10-somite staged embryos injected with CTRL (i) or col2a1-ASO (ii). In lateral views anterior is to the left, and in dorsal views anterior is up. Numbers and percentages of embryos/larvae with phenotype are indicated in each panel. Scale bars (200 µm) are represented in Ai and Bi. cb 3-7: ceratobranchial cartilages 3 to 7; ch: ceratohyal cartilage; hs: hyosymplectic cartilage; m: Meckel’s cartilage; pf: pectoral fin; pq: palatoquadrate cartilage; r3/5: rhombomeres 3 and 5; s: somites. |
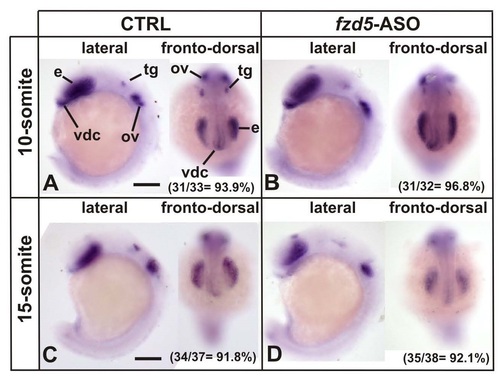
Analysis of tbx2b expression pattern in fzd5-ASO injected embryos. WISH assessing the expression of tbx2b mRNA as a marker of ventral diencephalon, eyes, trigeminal ganglion, and otic vesicles in 10-somite (A-B) and 15-somite (C-D) staged embryos injected with CTRL (A, C) or fzd5-ASO (B, D). In lateral views anterior is to the left, and in fronto-dorsal views dorsal is up. Numbers and percentages of embryos/larvae with phenotype are indicated in each panel. Scale bars (200 µm) are represented in A and C. e: eyes; ov: otic vesicles; tg: trigeminal ganglion; vdc: ventral diencephalon. |
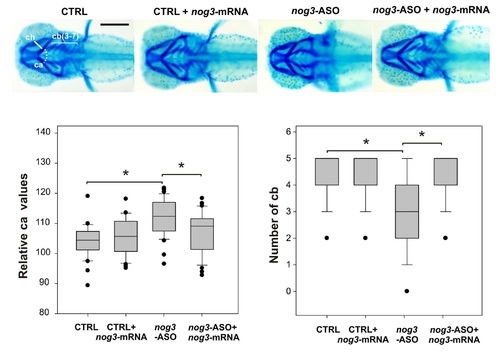
Rescue of the zebrafish embryos phenotype produced by nog3-ASO injection by coinjection with nog3-mRNA. Representative pictures of Alcian Blue staining of craniofacial cartilages along with box-plots of the relative ceratohyal cartilages angle and ceratobranchial cartilages number of 4-dpf staged larvae injected with CTRL, CTRL + nog3- mRNA, nog3-ASO and nog3-ASO + nog3-mRNA. * p<0.05, t-Student test. Scale bar represents 200 µm. Ventral views, anterior to the left. ca: ceratohyal cartilages angle; cb(3-7): ceratobranchial cartilages 3 to 7; ch: ceratohyal cartilage. |
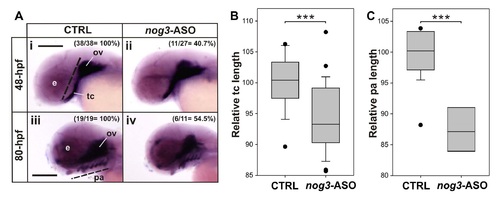
Analysis of differentiated chondrocytes pattern in nog3-ASO injected embryos. A. WISH assessing the expression of col2a1 mRNA as a marker of differentiated chondrocytes in 48-hpf staged embryos (i-ii) and 80-hpf staged larvae (iii-iv) injected with CTRL (i, iii) or nog3-ASO (ii, iv). Lateral views, anterior to the left. Numbers and percentages of embryos/larvae with phenotype are indicated in each panel. B. Box-plot of the relative tc length in 48-hpf staged embryos injected with CTRL or nog3-ASO. C. Boxplot of the relative pa length (distance from the first to the last pa) in 80-hpf staged larvae injected with CTRL or nog3-ASO. *** p<0.001, t-Student test. Scale bars (200 µm) are represented in Ai and Aiii. e: eye; ov: otic vesicle; pa: pharyngeal arches; tc: trabeculae cranii. |

Developmental phenotypic analysis of embryos injected with actb2-ASOs. A. Numbers and percentages of embryos showing dead, deformed or normal phenotypes are shown in a table and represented in a stacked bar graph for 48-hpf staged embryos injected with CTRL, actb2(+)-ASO or actb2(-)-ASO. No significant differences in developmental phenotypes were observed (chi-square test at p<0.1). B. Representative pictures of groups of embryos injected with CTRL (i), actb2(+)-ASO (ii) or actb2(-)-ASO (iii). C. Representative pictures of individual embryos injected with CTRL (i), actb2(+)-ASO (ii) or actb2(-)-ASO (iii). Lateral views, anterior to the left. Scale bars (1000 µm) are represented in Bi and Ci. |