
|
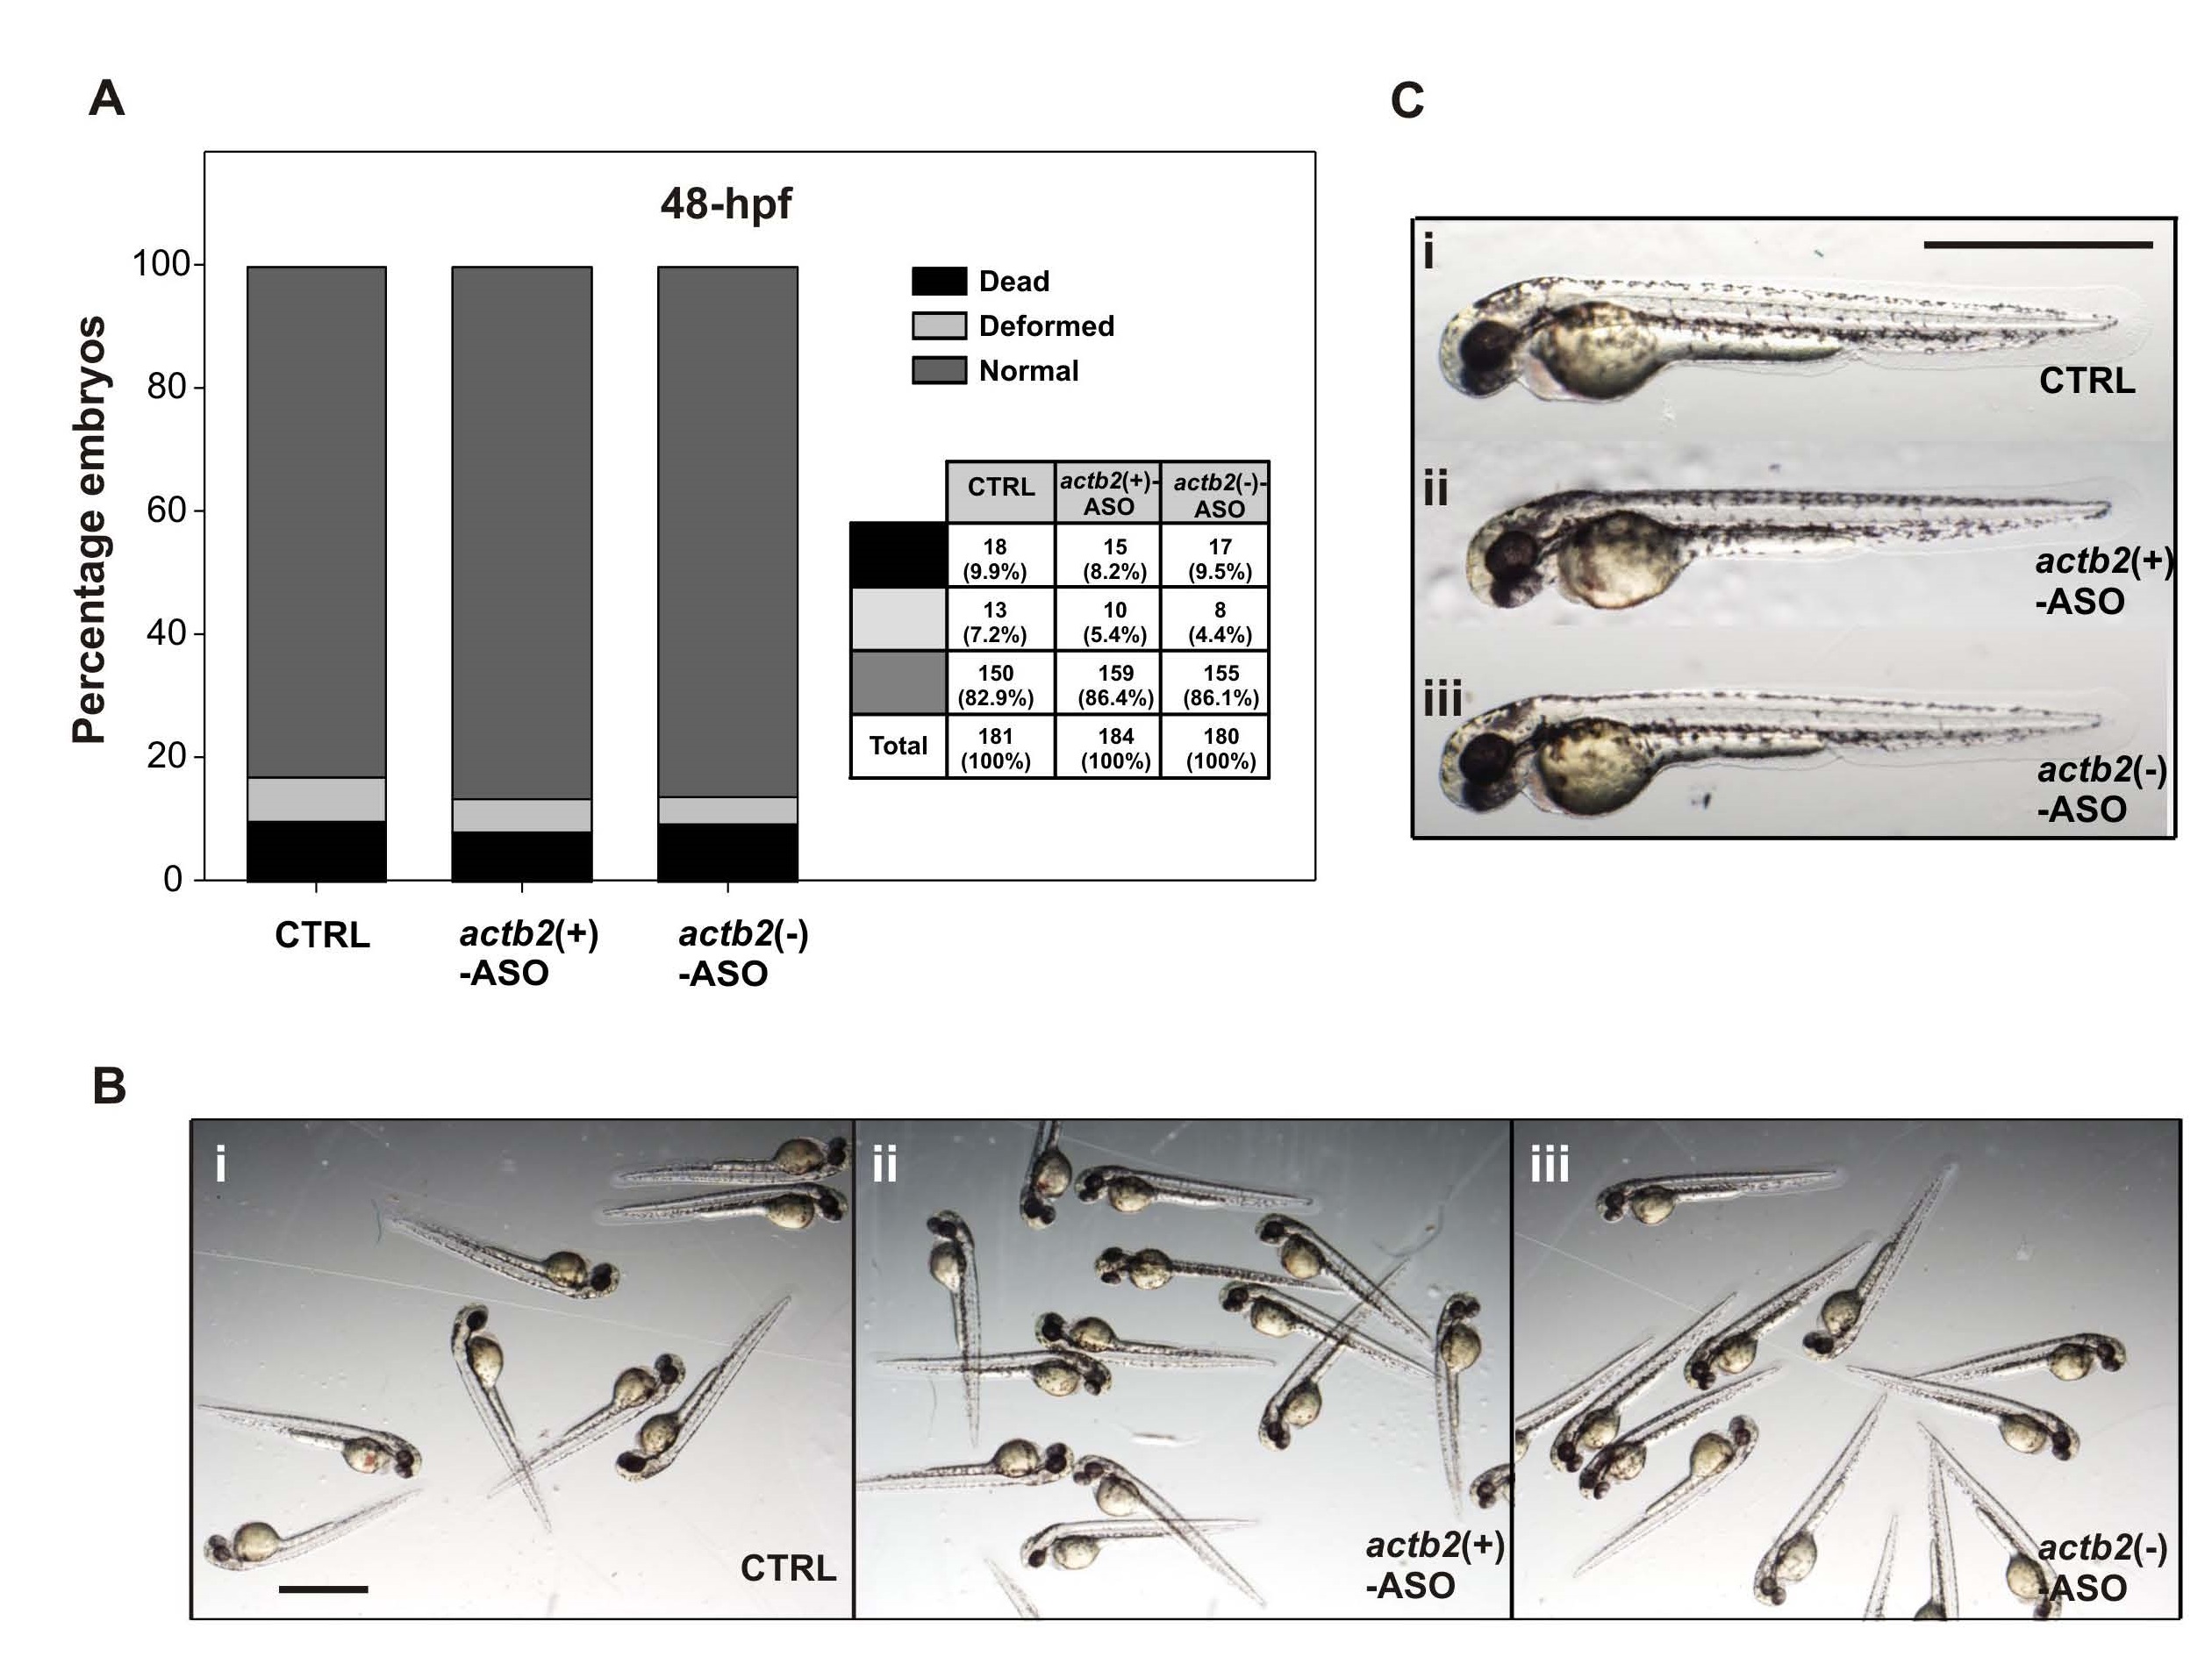
Fig. S11
Developmental phenotypic analysis of embryos injected with actb2-ASOs. A. Numbers and percentages of embryos showing dead, deformed or normal phenotypes are shown in a table and represented in a stacked bar graph for 48-hpf staged embryos injected with CTRL, actb2(+)-ASO or actb2(-)-ASO. No significant differences in developmental phenotypes were observed (chi-square test at p<0.1). B. Representative pictures of groups of embryos injected with CTRL (i), actb2(+)-ASO (ii) or actb2(-)-ASO (iii). C. Representative pictures of individual embryos injected with CTRL (i), actb2(+)-ASO (ii) or actb2(-)-ASO (iii). Lateral views, anterior to the left. Scale bars (1000 µm) are represented in Bi and Ci.