
|
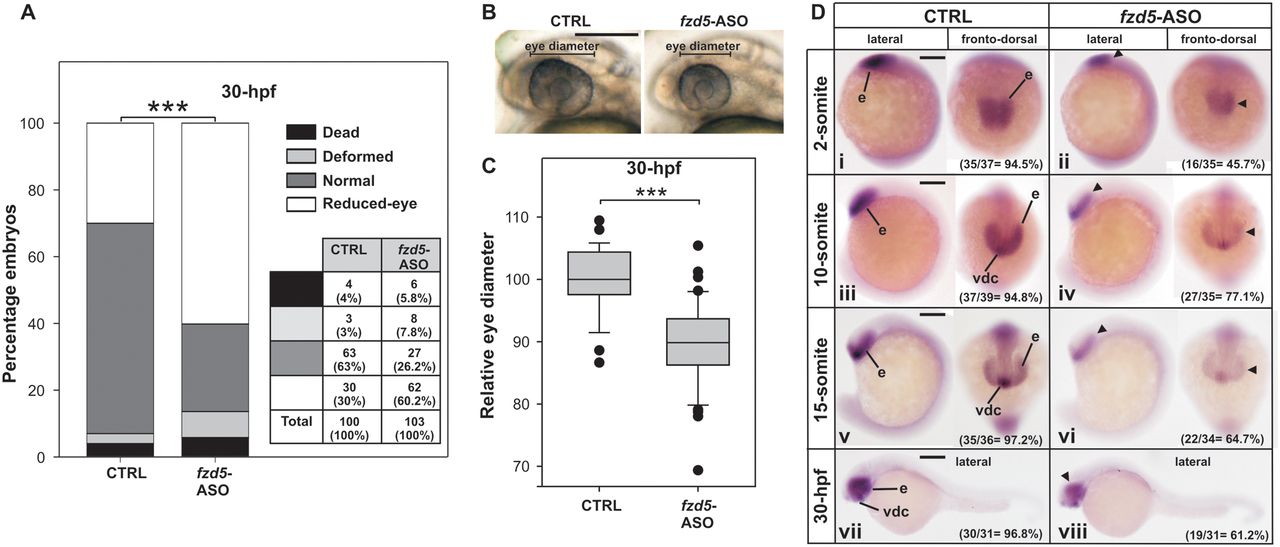
Fig. 6
Effect of fzd5 G-quadruplex disruption by fzd5-ASO injection in zebrafish embryos. (A) Numbers and percentages of embryos showing dead, deformed, normal or reduced-eye phenotypes are shown in a table and represented in a stacked bar graph for 30-hpf staged embryos injected with CTRL or fzd5-ASO. ***P < 0.001, chi-square test. (B) Representative picture of 30-hpf staged embryos injected with CTRL or fzd5-ASO used to determine eye diameter. Lateral views, anterior to the left. (C) Box-plot of the relative eye diameter of 30-hpf staged embryos injected with CTRL or fzd5-ASO. ***P < 0.001, t-Student test. (D) WISH assessing the expression of fzd5 mRNA in 2-somite (i and ii), 10-somite (iii and iv), 15-somite (v and vi) and 30-hpf (vii and viii) staged embryos injected with CTRL (i, iii, v and vii) or fzd5-ASO (ii, iv, vi and viii). Arrowheads point regions of lower expression. In lateral views anterior is to the left, and in fronto-dorsal views anterior is up. Numbers and percentages of embryos/larvae with the shown phenotype are indicated in each panel. e: eye; vdc: ventral diencephalon. Scale bars (200 µm) are represented in B, Di, Diii, Dv and Dvii.