
|
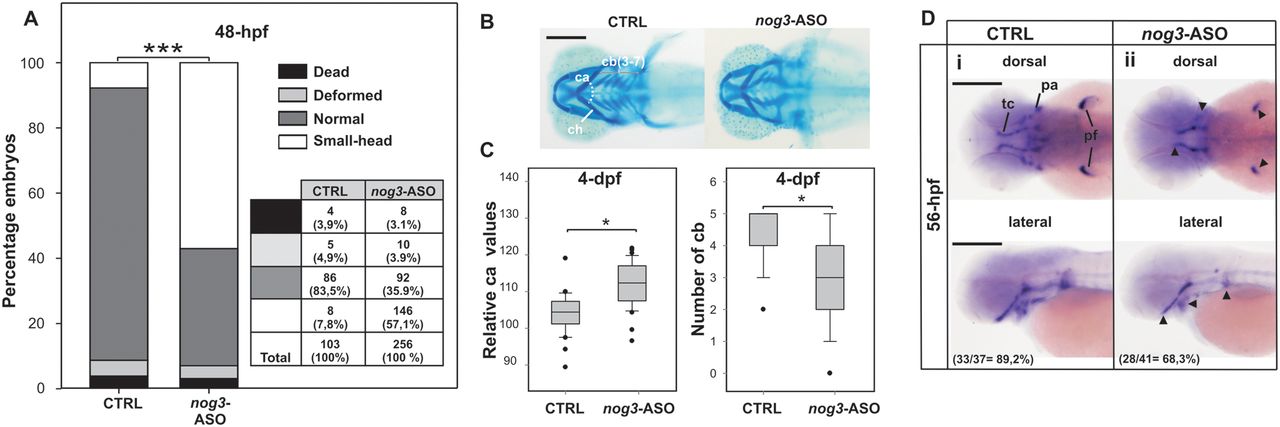
Fig. 7
Effect of nog3 G-quadruplex disruption by nog3-ASO injection in zebrafish embryos. (A) Numbers and percentages of embryos showing dead, deformed, normal or small head phenotypes are shown in a table and represented in a stacked bar graph for 48-hpf staged embryos injected with CTRL or nog3-ASO. ***P < 0.001, chi-square test. (B) Representative picture of Alcian Blue staining of craniofacial cartilages in 4-dpf staged larvae injected with CTRL or nog3-ASO. Ventral views, anterior to the left. (C) Box-plots of the relative ceratohyal cartilages angle and ceratobranchial cartilages number of 4-dpf staged larvae injected with CTRL or nog3-ASO. *P < 0.05, t-Student test. (D) WISH assessing the expression of nog3 mRNA in 56-hpf staged larvae injected with CTRL (i) or nog3-ASO (ii). Arrowheads point regions of lower expression. In lateral and dorsal views anterior is to the left. Numbers and percentages of embryos/larvae with the shown phenotype are indicated in each panel. ca: ceratohyal cartilages angle; cb (3-7): ceratobranchial cartilages 3 to 7; ch: ceratohyal cartilage; pa: pharyngeal arches; pf: pectoral fin; tc: trabeculae cranii. Scale bars (200 µm) are represented in B and Di.