
- Title
-
Oocyte Polarization Is Coupled to the Chromosomal Bouquet, a Conserved Polarized Nuclear Configuration in Meiosis
- Authors
- Elkouby, Y.M., Jamieson-Lucy, A., Mullins, M.C.
- Source
- Full text @ PLoS Biol.
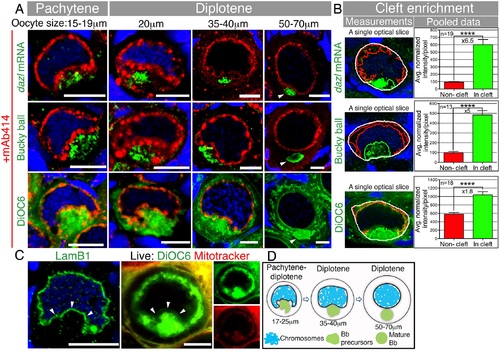
The Bb begins to form in a nuclear cleft at the onset of pachytene.(A) Tracking of dazl mRNA, Buc, and DiOC6 (membrane marker of organelles), together with mAb414 (a marker of nuclear pores, red) and DAPI (blue). The nuclear cleft morphology and in-cleft aggregation at pachytene through diplotene (≤40 µm) stages, as well as the normal Bb at diplotene (50–70 µm) stages, were observed in 100% of the oocytes (dazl, n = 26 ovaries; Buc, n = 8 ovaries, DiOC6, n > 100 ovaries). mAb414 detects the NE (fine line) and perinuclear granules (spherules, S4C Fig). mAb414 channel is omitted in DiOC6 50–70 µm. Arrowheads: mature Bb. In all figures, images are partial sum projections, unless noted otherwise. Scale bar: 10 µm. Oocyte sizes (diameter in µm) are indicated at top of panels. (B) Quantification of Bb precursor enrichment in the nuclear cleft of pachytene to early diplotene oocytes (17–25 µm). Left panels are examples of automated measurements (cleft analysis; white, entire measured cytoplasm; red, noncleft cytoplasm; green, cleft cytoplasm; S1 Fig shows the full stacks; S1 Data). Mean and standard error of the mean (SEM) of pooled data are plotted in the graphs. p-value, ****<0.0001; average fold enrichment is indicated (×). (C) LamB1 and DAPI (blue) labeling in fixed ovaries (n = 15 ovaries), and images of live oocytes from whole ovaries (n = 13 ovaries) stained with DiOC6 and Mitotracker, confirms the shape of the NE (arrowheads) during cleft stages. (D) A schematic of the Bb precursor aggregate during cleft stages and in the mature Bb. |
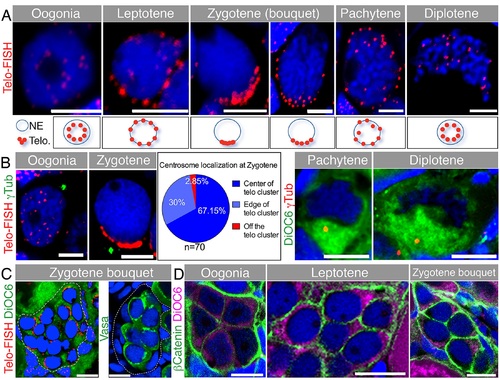
Telomere dynamics and the centrosome during early meiosis and the chromosomal bouquet configuration. (A) Telomere (Telo-FISH) dynamics in early meiotic zebrafish oocytes costained with DAPI (blue). Nuclear zoom-in views are shown (n = 41 ovaries). Scale bar: 5 µm. Lower panels show schematics of telomere positions in the corresponding stages. (B) Centrosome localization during early meiosis. Left: costaining of γTub, Telo-FISH and DAPI (blue; n = 8 ovaries). Pie chart: frequencies of zygotene centrosome localization relative to the telomere cluster. Right: costaining of γTub, DiOC6 and DAPI (blue; n = 7 ovaries). Scale bar: oogonia, zygotene is 5 µm; pachytene, diplotene is 10 µm. (C) Development of early meiotic oocytes in nests. Left: A group of zygotene oocytes (clustered telomeres marked by Telo-FISH in red) reside in a cluster (outlined) with follicle cells (amorphous smaller DAPI-positive cells) not apparent between them, but are present in the cluster periphery (n = 41 ovaries). Right: Detection of the germ cell specific marker Vasa (green) in zygotene cells (staged according to A—B and S3 Fig) are surrounded by Vasa-negative, DAPI-positive (blue) somatic follicle cells. The nest is outlined (n = 11 ovaries). Scale bars: 10 µm. Video S7 shows a 3-D view of a nest, demonstrating the intimate clustering of the zygotene oocytes, surrounded by follicle cell nuclei. (D) Early oocytes in the nest show adjacent cytoplasmic membranes (β-Catenin; green), costained with DiOC6 (magenta) and DAPI (blue) (n = 22 ovaries). Scale bar: 10 µm. |
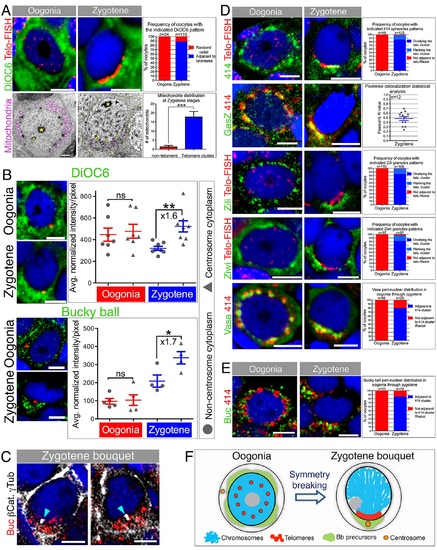
Aggregation of Bb precursor components in the telomere cluster cytoplasm.(A) Mitochondria localize to the telomere cluster. Top: DiOC6 pattern relative to telomeres (Telo-FISH) in oogonia and zygotene (DAPI, blue). Scale bar, 5 µm. Graph: DiOC6 pattern frequencies (S1 Data). Bottom: mitochondria (pseudocolored magenta) in oogonia and zygotene and relative to the presumptive telomere cluster. At zygotene, SCs are detected (arrowheads). SC-NE contact points mark the presumptive telomere cluster (yellow arrowheads). The cell membrane is outlined (orange) in zygotene. *, nucleoli. Scale bar, 2 µm. Graph: counts of mitochondria around the zygotene nucleus (n = 7 oocytes; S4 Fig; S1 Data). (B) DiOC6 and Buc distribution in oogonia and zygotene. Zygotene nest analysis (Materials and Methods) results are plotted showing enrichment around the centrosome cytoplasm (triangles) versus the remaining cytoplasm (circles) in zygotene but not oogonia (DiOC6: 6 ovaries Zygotene, n = 168 oocytes in 8 nests, Oogonia, n = 59 oocytes in 7 nests; Buc: 10 ovaries Zygotene, n = 111 oocytes in 4 nests, Oogonia, n = 21 oocytes in 5 nests). p-value: *<0.05; **<0.01; ns: not significant. Bars indicate mean and SEM. Average fold enrichment is indicated (×). Data in S1 Data. Scale bar, 5 µm. (C) Buc localizes to the centrosome (white) in zygotene (n = 13 ovaries). Labeling cell membranes (β-catenin; white) and analyzing individual oocytes confirms Buc localization to the centrosome cytoplasmic region (cyan arrowheads; 100%, n = 14 oocytes). Two examples are shown. Scale bar, 5 µm (D) GasZ and piRNA pathway granules localize to the telomere cluster. mAb414 spherules, Zili and Ziwi patterns relative to telomeres (Telo-FISH), and GasZ and Vasa relative to mAb414 in oogonia and zygotene (DAPI costained, blue). Scale bar, 5 µm. mAb414, Zili, Ziwi, and Vasa graphs indicate patterns frequencies (S1 Data). GasZ graph shows pixel-wise Pearson correlation coefficient of GasZ and mAb414 signals, confirming colocalization (Materials and Methods; S1 Data). (E) mAb414 NE spherules (red) position in oogonia and zygotene oocytes further confirms Buc (green) radial distribution in oogonia and localization to the telomere cluster apposing cytoplasm at zygotene in individual cells. Graph indicates patterns and frequencies (S1 Data). (F) A schematic of oocyte symmetry breaking at the zygotene bouquet. |
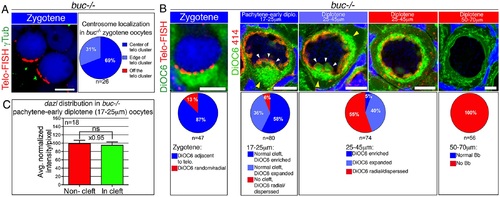
Early oocyte polarization is normal in buc-/- oocytes.(A) Telomere clustering and centrosome positioning (DAPI, blue) are normal in buc-/- oocytes (n = 5 ovaries). Pie chart: centrosome position frequencies. (B) buc-/- ovaries display normal early polarization. Pie charts show the frequencies of each phenotype. The typical phenotype is shown (top), with colors matching the represented phenotype in the charts (n = 26 ovaries). White arrowheads, nuclear cleft; yellow arrowheads, DiOC6 enrichment. Scale bars as in Fig 2B. (C) Cleft analysis results for dazl localization in buc-/- pachytene to early diplotene oocytes. Compare with Wt in Fig 1B. Mean and SEM are plotted. ns, not significant. Data in S1 Data. |
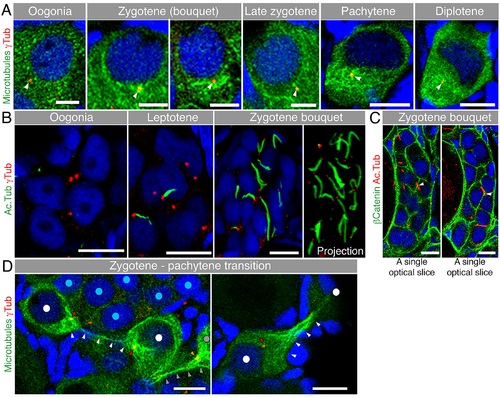
Microtubules in early meiosis.(A) Microtubule (Tg(βAct:emtb-3GFP), immunostained for GFP, green) organization during early meiotic oocytes costained with γTub (red) and DAPI (blue) (n = 6 ovaries). Scale bar: oogonia, zygotene = 5 µm; pachytene, diplotene = 10 µm. (B) Acetylated microtubule (Ac.Tub) cables in the nest. Ac.Tub cables (green) associate with centrosomes (red) of leptotene (center) and zygotene (right) oocytes (costained with DAPI), but are not present in oogonia (left) (n = 4 ovaries). Scale bar: 10µm. Right panel shows a full projection of Ac.Tub cables and centrosomes in the zygotene nest shown (see also S8 Video). (C) Some Ac.Tub cables (red) appeared to extend across the cell membranes (β-Catenin; green) of neighboring oocytes in the nest (costained with DAPI, blue; n = 12 ovaries). Arrowheads indicate crossing sites. Scale bar: 10 µm. Two single optical slices of the same nest are shown, see also S9 Video. (D) Zygotene to pachytene transitioning oocytes (DAPI, blue) show thin microtubule connections (Tg(βact:emtb-3GFP), green; white arrowheads) from the dense microtubule network around the centrosome (red; red arrowheads) of one cell to that of the other (n = 6 ovaries). The nuclei of the connected oocytes are labeled with white dots. Grey dot, grey and orange arrowheads indicate another oocyte with its centrosome and microtubule connection to an oocyte outside the image plane. Such oocytes were always observed in the periphery of a zygotene nest (nuclei labeled with blue dots, left panel; outside the image plane of right panel). Scale bar: 10 µm. Arrowheads indicate the centrosomes. |
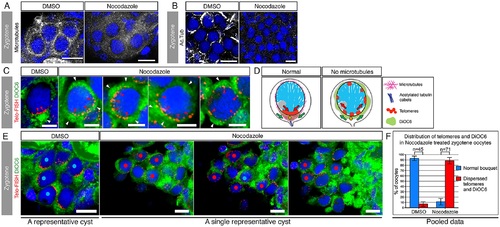
Nuclear telomere clustering and cytoplasmic Bb precursor localization are mechanistically coordinated by the bouquet microtubules.(A) Bouquet microtubules (Tg(βAct:emtb-3GFP), white) are intact in DMSO-treated ovaries (100%; n = 4 ovaries), but depolymerized in nocodazole treated ovaries (100%; n = 5 ovaries). A representative zygotene nest is shown (costained with DAPI, blue). Scale bar: 10 µm. (B) Acetylated tubulin cables (white) are intact in DMSO ovaries (100%; n = 3 ovaries), but are lost in nocodazole treated ovaries (100%; n = 6 ovaries; except for rare cases (3 nests) where cables were still intact, all other nest cables were disrupted). A representative zygotene nest is shown (costained with DAPI, blue). Scale bar: 10 µm. (C) Microtubules are simultaneously required for telomere clustering and DiOC6 localization at zygotene bouquet. DMSO zygotene oocytes (left panel) show the typical bouquet telomere cluster (Telo-FISH, red, red arrowheads) with the apposing localized DiOC6 (green, white arrowhead), similar to WT control (compare with Fig 4A). In contrast, nocodazole treatments (four right panels) resulted in simultaneous radial expansion of both telomeres and DiOC6. Four representative oocytes are shown. Note the partial to complete radial expansion of telomeres (red arrowheads) and the concomitant expansion and ectopic enrichments of DiOC6 (white arrowheads). Scale bar: 5 µm. (D) Schematics of the effects of the loss of microtubules on telomeres and DiOC6 distributions during zygotene bouquet. (E) Quantification of the results shown in (C). Zygotene oocytes were scored blind and mid-zygotene oocytes (11.5–13 µm) were selected for analysis. These were examined for their telomere clustering and DiOC6 patterns. A representative DMSO control nest is shown (left), where zygotene oocytes show the typical telomere clustering and apposing DiOC6 localization (nuclei labeled with blue dots). Partial projections of three different planes of a representative nocodazole-treated nest are shown (three right panels sequentially). In this nest, 10 oocytes showed radially-expanded telomeres as well as radial expansion, dispersion, or ectopic enrichments of DiOC6 (nuclei labeled with red dots), and one oocyte was normal (blue dot). Scale bar: 10 µm. (F) Pooled statistics of the analyzed nests as in (E). 93% (n = 45) of DMSO midzygotene oocytes were normal, while only 11.5% of midzygotene oocytes in nocodazole-treated ovaries were normal and 88.5% (n = 71) showed the effects described in (C, E). Bars are standard deviation (SD) of two independent experiments. Data in S1 Data. |
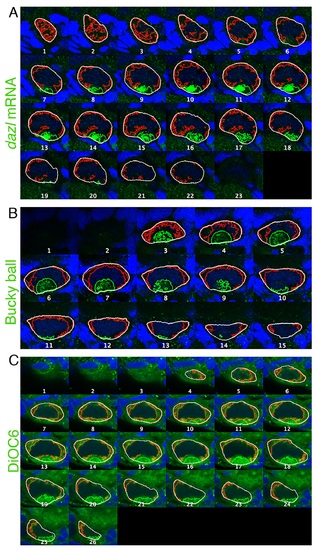
A montage of the full stack of images of the oocyte shown in Fig 1B.Staining: dazl (green), or Buc, or DiOC6, DAPI (blue). Measurements lines: oocyte outline (white), noncleft cytoplasm (red), cleft cytoplasm (green). See cleft analysis in S5 Fig. |
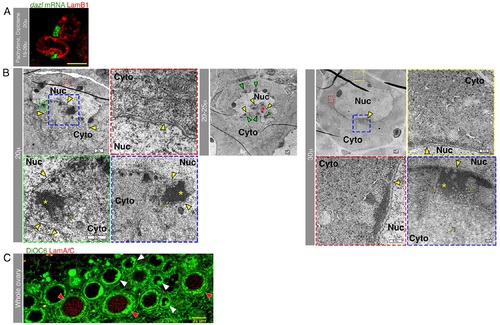
The nuclear cleft is a feature of the early oocyte.(A) The nuclear cleft, as visualized with LamB1, is enriched with the Bb precursor dazl RNA. Diplotene onset (top), pachytene (bottom). S2 Video shows the full stack of images of these oocytes, and S3 Video shows their 3-D view. (B) TEM images of representative ~20 µm (µ), ~20–25 µm and ~30 µm oocytes showing the typical nuclear cleft for these stages. The colors of framed regions in lower magnification images match the frame colors of the corresponding higher magnification images. Blue and green frames are higher magnification views of in-cleft cytoplasm. Red and yellow frames are higher magnification views of noncleft cytoplasm. The NE (yellow arrowheads) is concave forming the cleft, which is enriched with mitochondria (yellow arrows are examples of mitochondria) and electron-dense material presumably detecting mRNPs (*). Non-cleft cytoplasm contains presumptive mRNPs but is not enriched with mitochondria, and its adjacent NE is not concave. Cyto, cytoplasm; Nuc, nucleus. Note the nuclear peninsulas in the more pronounced cleft of the ~20 µm oocyte. In the ~20–25 µm oocyte, the cleft appears to be perpendicular to the image plane, with a view into the cleft. Note the cytoplasm (red *) engulfed by the nuclear protrusions and the presumptive mRNP clusters (green arrowheads) all around the NE inside the cleft. On the confocal microscope, as shown here in TEM, the nuclear cleft morphology of the 30 µm oocyte is consistently milder. Scale bars are indicated. (C) LamA/C is specifically detected in postcleft oocytes where the nucleus resumes a spherical shape (red arrowheads). Cleft stages are marked with white arrowheads. DiOC6 detects the concave NE and the cleft-enriched mitochondria. S4 Video shows the complete confocal stack. LamB1 is expressed in cleft (panel A; Fig 1C) and postcleft stages. |
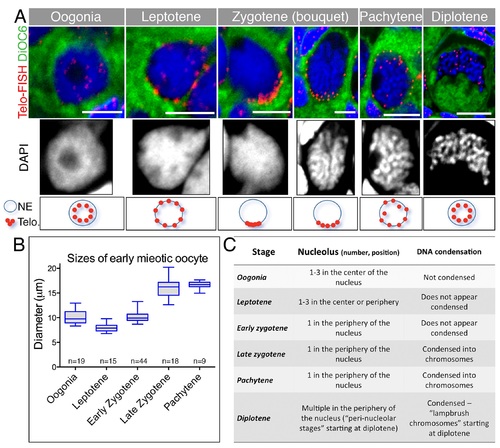
Precise criteria for staging early meiotic zebrafish oocytes.(A) Top: Images of the entire oocytes in Fig 2A, also showing DiOC6, which labels the cytoplasm and makes evident the size of the oocyte. Bottom: Nuclear zoom-in views of the same oocytes. DAPI (greyscale) show chromosome morphology. Range of sizes for specific stages is plotted in (B). Oocytes from 3–4 ovaries per stage were measured. Data in S1 Data. (C) Additional nuclear morphological criteria for each stage, including nucleolus number and positions, as well as DNA condensation, state characteristic of these early stages. These criteria expand upon the previously described characteristics of early oocytes in the zebrafish [38–40]. |
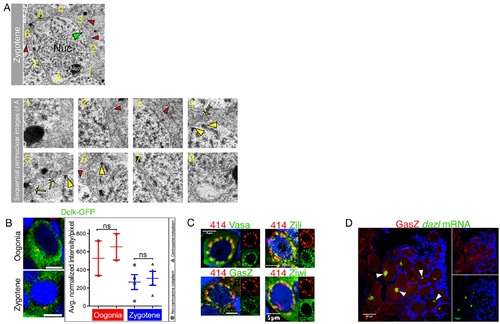
Supporting information for Fig 3.(A) Quantification of mitochondrial enrichment in zygotene bouquet TEM image overlapping high magnification images of the entire cytoplasm 360° around the nucleus of the cell in the top panel are shown in the lower panels. Image numbers (bottom) correspond to the numbered regions (top). SC-NE contact points (yellow arrowheads) mark the presumptive telomere cluster. Mitochondria (examples are marked by yellow arrows) were counted in regions adjacent to SC-NE contact points versus regions that are not. In this example, frames 4–6 span the presumptive telomere cluster. Mitochondria are mostly found in the cytoplasm apposing this region versus that of frames 1–3 and 7–8. Pooled data are plotted in Fig 4A (n = 7 oocytes). Zygotene oocytes were identified by their size (measurements are shown in A), the detection of SC, and the typical peripheral nucleolus. Nuc, nucleus; Cyto, cytoplasm; nucl, nucleolus. Green arrowhead, NE; red arrowhead, cell membrane. Red arrowheads in the entire cell (top) indicate to the same regions in the corresponding smaller higher power images. (B) Zygotene nest analysis for DCLK-GFP, as shown in Fig 3B for DiOC6 and Buc. DCLK appears randomly radially distributed and shows no enrichment in the centrosome cytoplasm of either oogonia or zygotene oocytes (n = 5 ovaries Zygotene, n = 26 oocytes in 4 nests, Oogonia, n = 6 oocytes in 2 nests). Data in S1 Data. (C) mAb414 detects the NE and colocalizes with perinuclear granules in zebrafish oocytes. The mAb414 perinuclear spherules signal (distinct from the fine line of the NE) colocalizes with the piRNA-specific proteins Vasa (n = 8 ovaries), GasZ (n = 7 ovaries), Zili, (n = 4 ovaries), and Ziwi (n = 4 ovaries), here shown in oogonia. GasZ oocyte shown is the same cell shown in Fig 3C, but also showing the different channels separately. (D) GasZ is a Bb resident protein during mid-to-late diplotene stages. GasZ colocalizes with dazl mRNA (costained with DAPI, blue) in the mature Bb (arrowheads; n = 8 ovaries). |
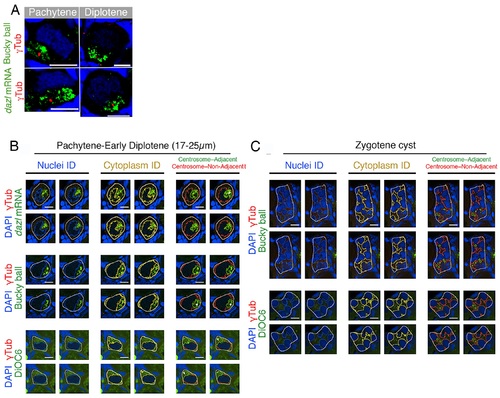
Supporting information for cleft and nest analyses.(A) Bb precursor components in the cleft are aggregated around the centrosome. The centrosome localizes to the nuclear cleft throughout pachytene (cleft formation) to early diplotene (≤25 µm). Bb precursors aggregate in the cleft surrounding the centrosome (dazl, n = 6 ovaries; Buc, n = 10 ovaries; DiOC6, Fig 2B). (B) Identification of oocyte subregions for the cleft analysis using a MATLAB code. Representative images of pachytene and early diplotene (17–25 µm) oocytes quantified with cleft analysis. Each panel shows four adjacent single z-slices. Identified nuclei (left column) were subtracted to reveal the cytoplasm region only (center column). In the identified overall cytoplasm, subregions of centrosome-adjacent and centrosome-nonadjacent cytoplasm were identified (right column). Staining: experimental stain (green), γTub (red), DAPI (blue). Outlined regions: region of interest (ROI) (white), all nuclei (blue), all cytoplasm (yellow), centrosome-adjacent cytoplasm (green), centrosome-nonadjacent cytoplasm (red). Scale bars are 10µm. (C) Identification of oocyte subregions for the nest analysis using a MATLAB code. Representative images of nests of zygotene oocytes quantified with zygotene nest analysis. Each panel shows four adjacent single z-slices. Identified nuclei (left column), cytoplasm region only (center column), and subregions of centrosome-adjacent and centrosome-nonadjacent cytoplasm (right column) are shown as in B. Staining, outlines, and scale bar as in B. |
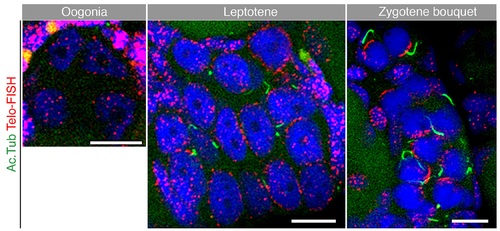
Supporting information for Fig 3.Telo-FISH staining (red) confirms the stage specificity of the acetylated tubulin cables (green) in the nest (costained with DAPI, blue). Premeiotic oogonia with intranuclear scattered telomeres (left) show no acetylated tubulin cables. Leptotene oocytes with telomeres loaded radially on the NE show some cables (center). Zygotene oocytes with tightly clustered telomeres on the NE show more elaborated cables associated with them. n = 6 ovaries. Scale bar: 10 µm. |