
|
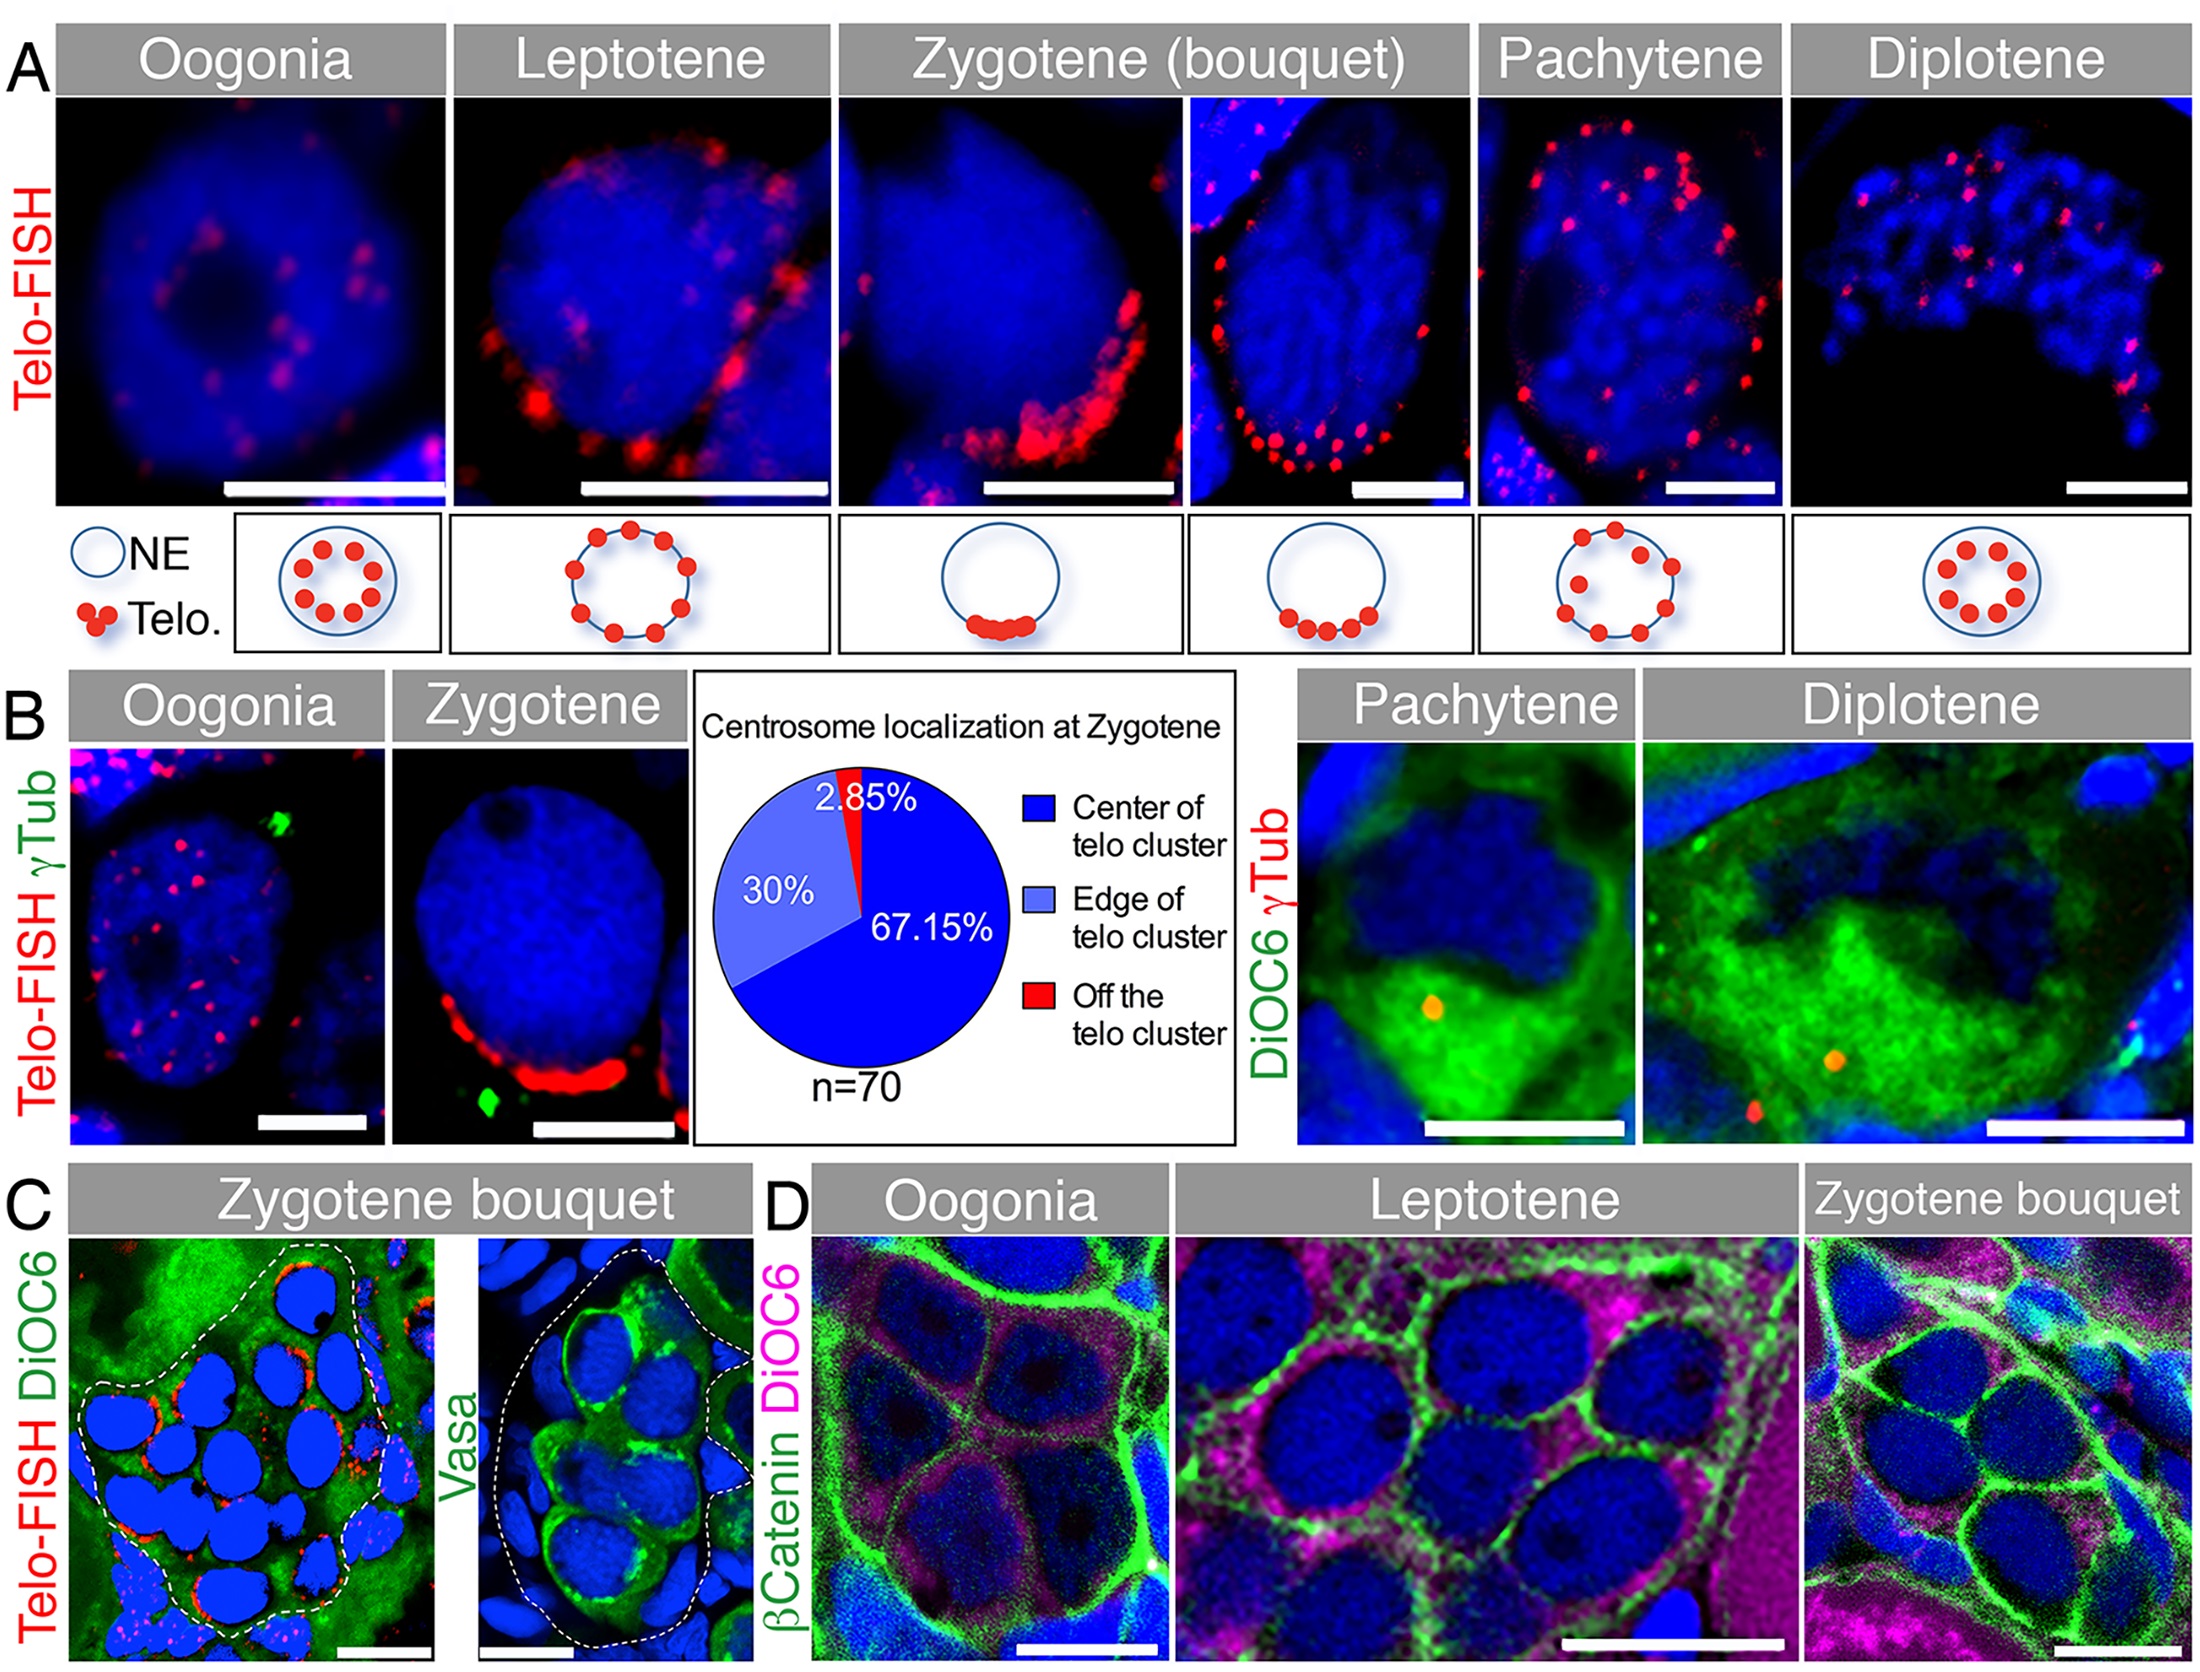
Fig. 2
Telomere dynamics and the centrosome during early meiosis and the chromosomal bouquet configuration. (A) Telomere (Telo-FISH) dynamics in early meiotic zebrafish oocytes costained with DAPI (blue). Nuclear zoom-in views are shown (n = 41 ovaries). Scale bar: 5 µm. Lower panels show schematics of telomere positions in the corresponding stages. (B) Centrosome localization during early meiosis. Left: costaining of γTub, Telo-FISH and DAPI (blue; n = 8 ovaries). Pie chart: frequencies of zygotene centrosome localization relative to the telomere cluster. Right: costaining of γTub, DiOC6 and DAPI (blue; n = 7 ovaries). Scale bar: oogonia, zygotene is 5 µm; pachytene, diplotene is 10 µm. (C) Development of early meiotic oocytes in nests. Left: A group of zygotene oocytes (clustered telomeres marked by Telo-FISH in red) reside in a cluster (outlined) with follicle cells (amorphous smaller DAPI-positive cells) not apparent between them, but are present in the cluster periphery (n = 41 ovaries). Right: Detection of the germ cell specific marker Vasa (green) in zygotene cells (staged according to A—B and S3 Fig) are surrounded by Vasa-negative, DAPI-positive (blue) somatic follicle cells. The nest is outlined (n = 11 ovaries). Scale bars: 10 µm. Video S7 shows a 3-D view of a nest, demonstrating the intimate clustering of the zygotene oocytes, surrounded by follicle cell nuclei. (D) Early oocytes in the nest show adjacent cytoplasmic membranes (β-Catenin; green), costained with DiOC6 (magenta) and DAPI (blue) (n = 22 ovaries). Scale bar: 10 µm.