
Fig. 3
- ID
- ZDB-FIG-160225-5
- Publication
- Elkouby et al., 2016 - Oocyte Polarization Is Coupled to the Chromosomal Bouquet, a Conserved Polarized Nuclear Configuration in Meiosis
- Other Figures
- All Figure Page
- Back to All Figure Page
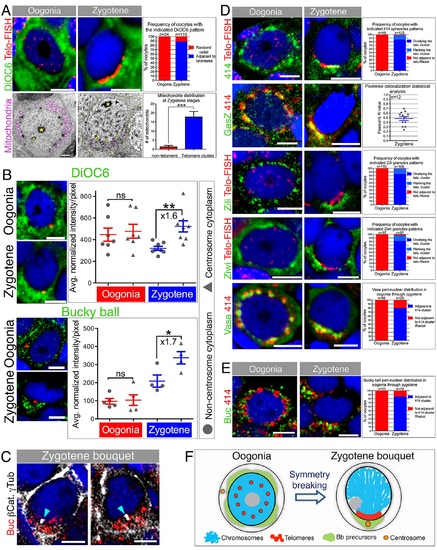
Aggregation of Bb precursor components in the telomere cluster cytoplasm.(A) Mitochondria localize to the telomere cluster. Top: DiOC6 pattern relative to telomeres (Telo-FISH) in oogonia and zygotene (DAPI, blue). Scale bar, 5 µm. Graph: DiOC6 pattern frequencies (S1 Data). Bottom: mitochondria (pseudocolored magenta) in oogonia and zygotene and relative to the presumptive telomere cluster. At zygotene, SCs are detected (arrowheads). SC-NE contact points mark the presumptive telomere cluster (yellow arrowheads). The cell membrane is outlined (orange) in zygotene. *, nucleoli. Scale bar, 2 µm. Graph: counts of mitochondria around the zygotene nucleus (n = 7 oocytes; S4 Fig; S1 Data). (B) DiOC6 and Buc distribution in oogonia and zygotene. Zygotene nest analysis (Materials and Methods) results are plotted showing enrichment around the centrosome cytoplasm (triangles) versus the remaining cytoplasm (circles) in zygotene but not oogonia (DiOC6: 6 ovaries Zygotene, n = 168 oocytes in 8 nests, Oogonia, n = 59 oocytes in 7 nests; Buc: 10 ovaries Zygotene, n = 111 oocytes in 4 nests, Oogonia, n = 21 oocytes in 5 nests). p-value: *<0.05; **<0.01; ns: not significant. Bars indicate mean and SEM. Average fold enrichment is indicated (×). Data in S1 Data. Scale bar, 5 µm. (C) Buc localizes to the centrosome (white) in zygotene (n = 13 ovaries). Labeling cell membranes (β-catenin; white) and analyzing individual oocytes confirms Buc localization to the centrosome cytoplasmic region (cyan arrowheads; 100%, n = 14 oocytes). Two examples are shown. Scale bar, 5 µm (D) GasZ and piRNA pathway granules localize to the telomere cluster. mAb414 spherules, Zili and Ziwi patterns relative to telomeres (Telo-FISH), and GasZ and Vasa relative to mAb414 in oogonia and zygotene (DAPI costained, blue). Scale bar, 5 µm. mAb414, Zili, Ziwi, and Vasa graphs indicate patterns frequencies (S1 Data). GasZ graph shows pixel-wise Pearson correlation coefficient of GasZ and mAb414 signals, confirming colocalization (Materials and Methods; S1 Data). (E) mAb414 NE spherules (red) position in oogonia and zygotene oocytes further confirms Buc (green) radial distribution in oogonia and localization to the telomere cluster apposing cytoplasm at zygotene in individual cells. Graph indicates patterns and frequencies (S1 Data). (F) A schematic of oocyte symmetry breaking at the zygotene bouquet. |