
Fig. S5
- ID
- ZDB-FIG-160225-13
- Publication
- Elkouby et al., 2016 - Oocyte Polarization Is Coupled to the Chromosomal Bouquet, a Conserved Polarized Nuclear Configuration in Meiosis
- Other Figures
- All Figure Page
- Back to All Figure Page
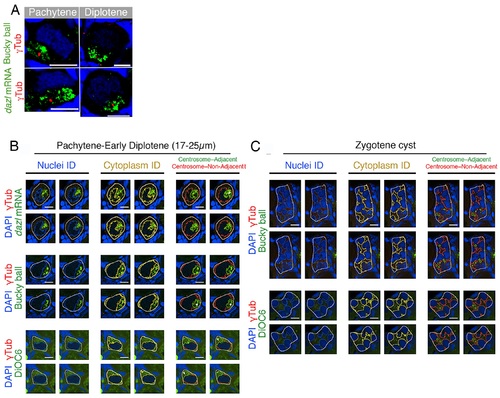
Supporting information for cleft and nest analyses.(A) Bb precursor components in the cleft are aggregated around the centrosome. The centrosome localizes to the nuclear cleft throughout pachytene (cleft formation) to early diplotene (≤25 µm). Bb precursors aggregate in the cleft surrounding the centrosome (dazl, n = 6 ovaries; Buc, n = 10 ovaries; DiOC6, Fig 2B). (B) Identification of oocyte subregions for the cleft analysis using a MATLAB code. Representative images of pachytene and early diplotene (17–25 µm) oocytes quantified with cleft analysis. Each panel shows four adjacent single z-slices. Identified nuclei (left column) were subtracted to reveal the cytoplasm region only (center column). In the identified overall cytoplasm, subregions of centrosome-adjacent and centrosome-nonadjacent cytoplasm were identified (right column). Staining: experimental stain (green), γTub (red), DAPI (blue). Outlined regions: region of interest (ROI) (white), all nuclei (blue), all cytoplasm (yellow), centrosome-adjacent cytoplasm (green), centrosome-nonadjacent cytoplasm (red). Scale bars are 10µm. (C) Identification of oocyte subregions for the nest analysis using a MATLAB code. Representative images of nests of zygotene oocytes quantified with zygotene nest analysis. Each panel shows four adjacent single z-slices. Identified nuclei (left column), cytoplasm region only (center column), and subregions of centrosome-adjacent and centrosome-nonadjacent cytoplasm (right column) are shown as in B. Staining, outlines, and scale bar as in B. |