
|
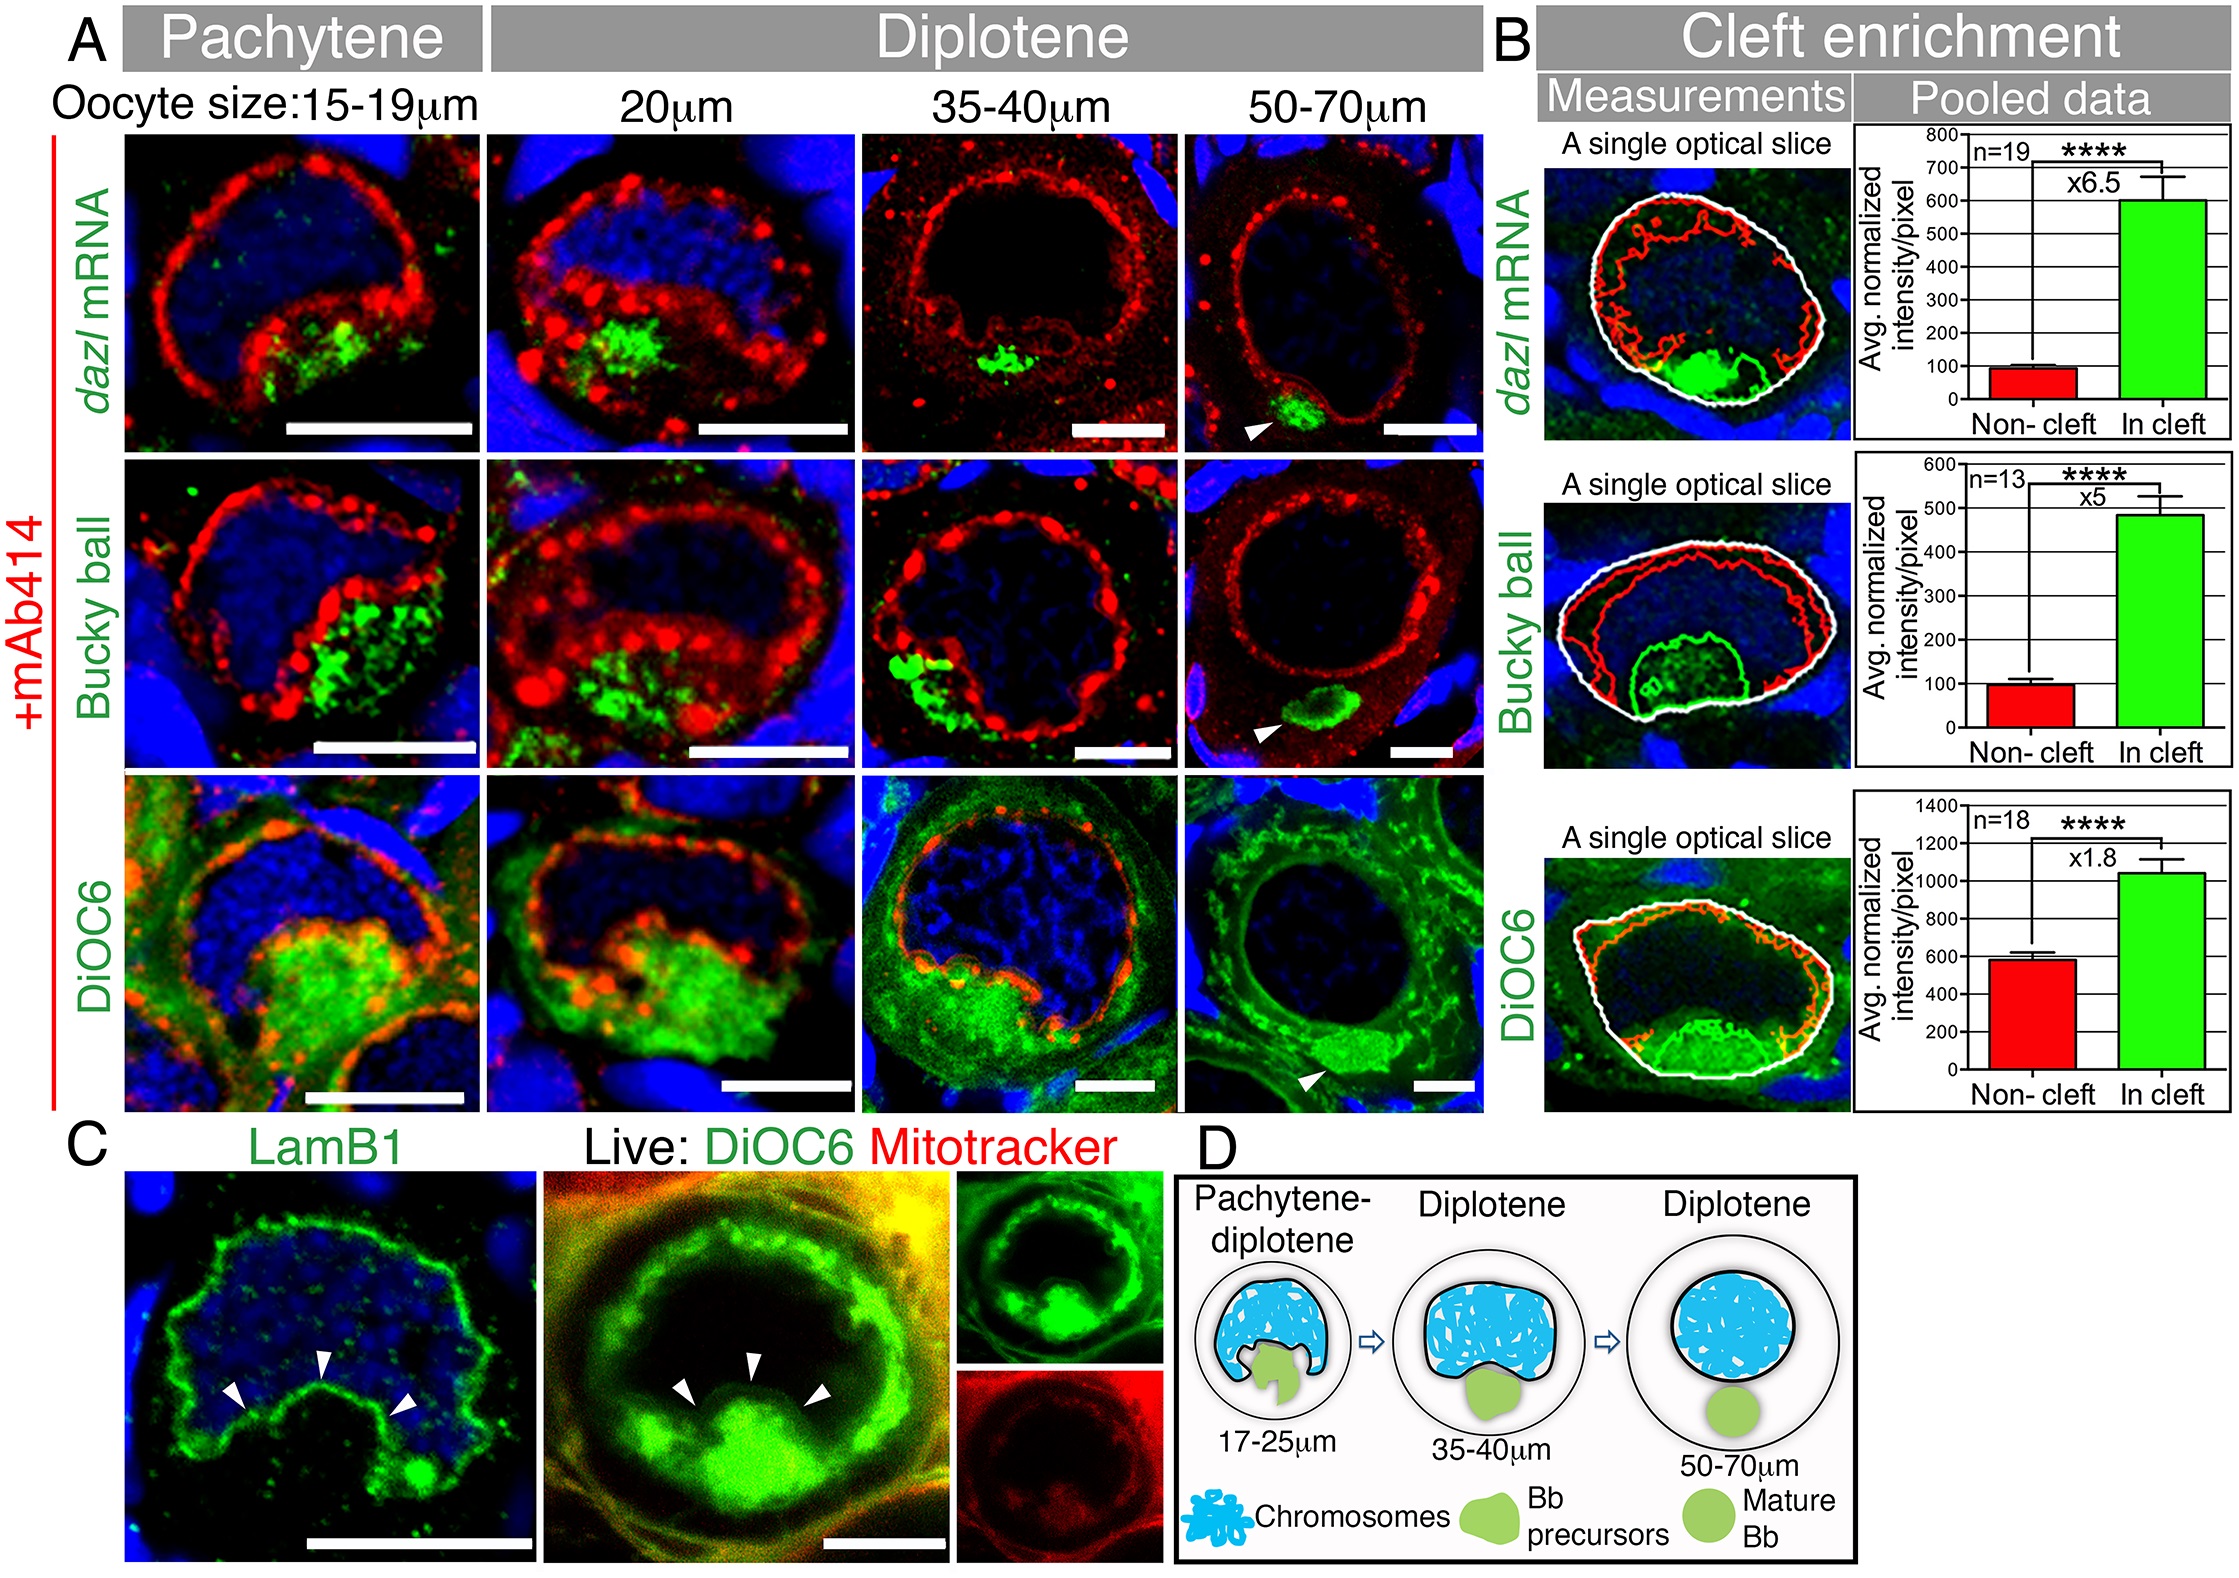
Fig. 1
The Bb begins to form in a nuclear cleft at the onset of pachytene.(A) Tracking of dazl mRNA, Buc, and DiOC6 (membrane marker of organelles), together with mAb414 (a marker of nuclear pores, red) and DAPI (blue). The nuclear cleft morphology and in-cleft aggregation at pachytene through diplotene (≤40 µm) stages, as well as the normal Bb at diplotene (50–70 µm) stages, were observed in 100% of the oocytes (dazl, n = 26 ovaries; Buc, n = 8 ovaries, DiOC6, n > 100 ovaries). mAb414 detects the NE (fine line) and perinuclear granules (spherules, S4C Fig). mAb414 channel is omitted in DiOC6 50–70 µm. Arrowheads: mature Bb. In all figures, images are partial sum projections, unless noted otherwise. Scale bar: 10 µm. Oocyte sizes (diameter in µm) are indicated at top of panels. (B) Quantification of Bb precursor enrichment in the nuclear cleft of pachytene to early diplotene oocytes (17–25 µm). Left panels are examples of automated measurements (cleft analysis; white, entire measured cytoplasm; red, noncleft cytoplasm; green, cleft cytoplasm; S1 Fig shows the full stacks; S1 Data). Mean and standard error of the mean (SEM) of pooled data are plotted in the graphs. p-value, ****<0.0001; average fold enrichment is indicated (×). (C) LamB1 and DAPI (blue) labeling in fixed ovaries (n = 15 ovaries), and images of live oocytes from whole ovaries (n = 13 ovaries) stained with DiOC6 and Mitotracker, confirms the shape of the NE (arrowheads) during cleft stages. (D) A schematic of the Bb precursor aggregate during cleft stages and in the mature Bb.