
- Title
-
Genome-wide Analysis of the Zebrafish Klf Family Identifies Two Genes important for Erythroid Maturation
- Authors
- Xue, Y., Gao, S., Liu, F.
- Source
- Full text @ Dev. Biol.

The expression of klf3 andklf6a in cloche, etsrp, and moonshine mutants. (A) The expression of klf3 was lost in cloche and moonshine mutants, whereas no change was observed in etsrp mutants at 26 hpf. The arrowheads mark red blood cells in the ICM. (B) klf6a expression in cloche and etsrp mutants was greatly decreased, but only slightly reduced in moonshine mutants at 30 hpf. The arrowheads mark klf6a expression in the posterior ICM region. Anterior is shown to the left, with dorsal to the top. |
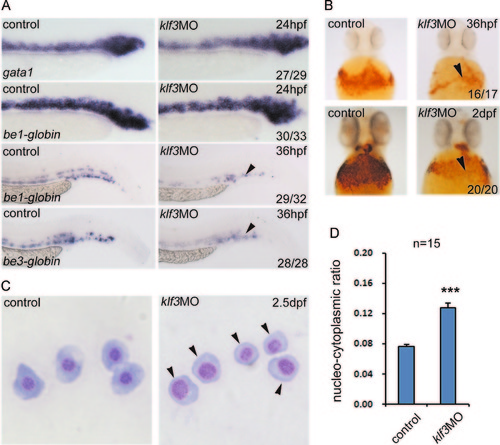
Maturation of erythrocytes was blocked inklf3 morphants. (A) The expressions of gata1 and be1-globin did not change in klf3 morphants at 24 hpf. However, the expressions of be1-globin and be3-globin were remarkably decreased during the differentiation and maturation of blood red cells at 36 hpf. The arrowheads mark RBCs in CHT. (B) O-dianisidine staining of hemoglobin during erythropoiesis. At 36 hpf and 2 dpf, the staining in klf3 morphants was significantly reduced, indicating that the maturation of RBCs was blocked. The RBCs in the heart region are indicated by arrowheads. (C) Blood-smear and Giemsa staining. At 2.5 dpf, the size and nucleo-cytoplasmic ratio of RBCs from klf3 morphants were increased compared with those of controls, indicating the arrest of erythroid cell maturation. The arrowhead marks the delayed erythroid progenitor. (D) Quantification of the nucleo-cytoplasmic ratio between controls and klf3 morphants (mean±SD, ***P <0.001, n=15). The nucleo-cytoplasmic ratio was calculated as follows: the diameter of nucleus (D1) and whole cell (D2) were measured by Photoshop, and the nucleo-cytoplasmic ratio (NCR) was calculated using formula |
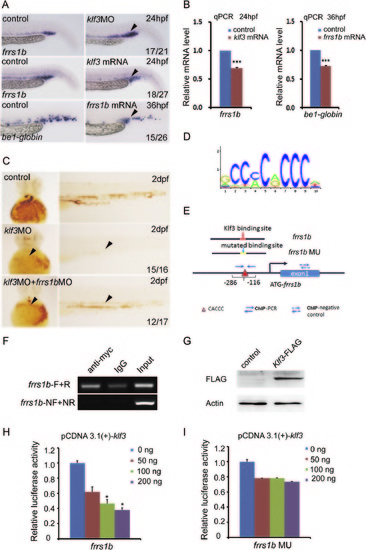
Frrs1b is downstream ofklf3 in the regulation of erythropoiesis. (A) Upper panels, the expression of frrs1b was increased in klf3 morphants at 24 hpf; middle panels, the expression of frrs1b was decreased in klf3 mRNA-injected embryos. The arrowheads indicate the expression of frrs1b in the ICM; lower panels, be1-globin expression was attenuated in frrs1b overexpressed embryos at 36 hpf, similar to the phenotype of klf3 knockdown embryos. The arrowheads mark the expression in the ICM. (B) qPCR results showed that frrs1b or be1-globin expressions were decreased when overexpression of klf3 or frrs1b, respectively (mean±SD, t-test, ***P<0.001, n=3). (C) The o-dianisidine staining was partially rescued when klf3 morphants were injected with frrs1bMO at 2 dpf. (D) The conserved core binding site of Klfs. (E) The schematic structure of the frrs1b promoter that was used in the reporter and ChIP assays. (F) ChIP-PCR. frrs1b-NF/NR are negative control primers that were used to amplify the frrs1b promoter region without the conserved Klf binding site. The frrs1b-F/R primers were used to amplify the promoter region containing the conserved Klf3 binding site. (G) Overexpression of zebrafish Klf3 in HEK293T cells. Actin was used as a loading control. Klf3 protein expression was detected with anti-FLAG antibody. (H and I) The luciferase activity of tested samples was normalized to the control, and the relative luciferase activity was calculated from three independent experiments (mean±SD, t-test, *P<0.05, n=3). HEK293T cells were co-transfected with the Renilla reporter plasmid, the frrs1b promoter construct or a mutant frrs1b promoter construct in which the Klf3 binding site CACC was changed to ACAA, and pCDNA-FLAG-Klf3. Luciferase assays were performed using the Dual-Luciferase Reporter Assay System. |
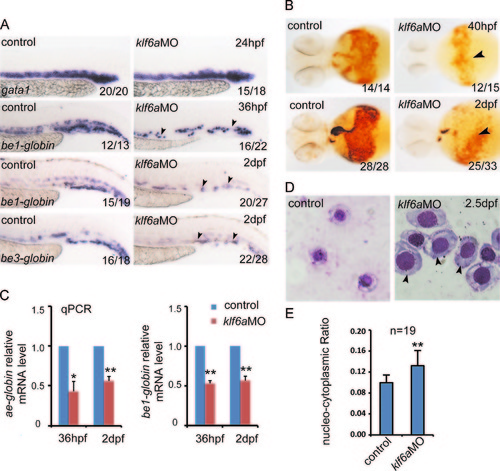
klf6a knockdown induces a blockage of erythroid cell differentiation and maturation. (A) WISH results showed that gata1 expression was comparable between controls and klf6a morphants from 24 hpf. The expression of be1-globin and be3-globin was decreased in klf6a morphants, compared with controls at 36 hpf and 2 dpf. (B) The number of o-dianisidine-positive cells (marked by arrowheads) decreased dramatically in klf6a morphants between 40 hpf and 2 dpf. (C) The real time PCR results displayed that ae1-globin and be1-globin were downregulated in klf6a morphants at 36 hpf and 2 dpf (mean±SD, *P <0.05, **P <0.01, n=3). (D) Giemsa staining of erythroid cells from the blood of controls and klf6a morphants at 2.5 dpf. The size and nucleo-cytoplasmic ratio of red blood cells in klf6a morphants were noticeably larger than those of controls. The arrowhead marks the delayed erythroid progenitor. (E) Quantification of the nucleo-cytoplasmic ratio between controls and klf6a morphants (mean±SD, NNP <0.01, n=19). |
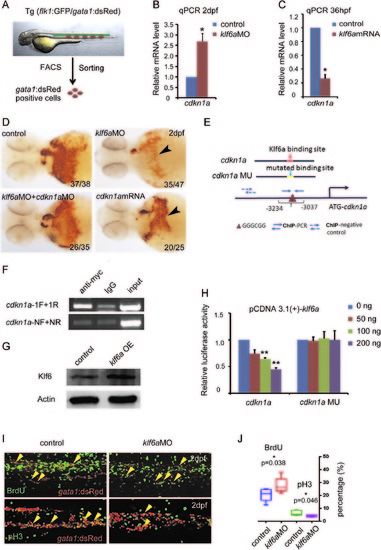
Cdkn1a acts downstream of klf6a to negatively regulate erythroid cell maturation by inducing cell cycle arrest. (A) Scheme of cell sorting by FACS. The gata1:dsRed-positive cells were sorted from the transgenic line flk1:GFP/gata1:dsRed at 2 dpf. (B) qPCR showed cdkn1a upregulation in the sorted cell population of klf6a morphants (mean±SD, t-test, *P<0.05, n=3). (C) qPCR analysis showed that cdkn1a was decreased in klf6a mRNA-injected embryos at 36 hpf (mean±SD, t-test, **P<0.01, *P<0.05, n=3). (D) O-dianisidine staining showed that the number of mature RBCs was reduced in klf6a morphants and cdkn1a mRNA-injected embryos, and the defect in klf6a morphants was rescued by co-injection of cdkn1aMO. The arrowheads mark o-dianisidine-positive cells. (E) Analysis of Klf6a binding to the cdkn1a promoter by ChIP assay. The schematic of the cdkn1a promoter structure that was used in the reporter and ChIP assays. (F) ChIP-PCR. cdkn1a-NF/NR were negative control primers that were used to amplify the cdkn1a promoter region without the conserved Klf6a binding site. The cdkn1a-1F/1R primers were used to amplify the promoter region containing the conserved Klf6a binding site. (G) Reporter assay. Western blot analysis of overexpression of zebrafish Klf6a in HEK293T cells. (H) HEK293T cells were co-transfected with the promoter construct of cdkn1a containing the conserved Klf6 binding sites (GGGCGG) or mutated sites (TTTAAA) and the pCDNA-Klf6a plasmid. (I) BrdU and pH3 staining indicated the gata1:dsRed positive cells in S and M phases in CHT region of 2 dpf Tg (gata1:dsRed) embryos. The yellow arrowheads mark the erythrocytes in S/M phase. (J) The statistic graph showed the percentages of BrdU+gata1:dsRed+ and pH3+gata1:dsRed+ in the CHT region (mean±SD, t-test, *P<0.05, n=5). |
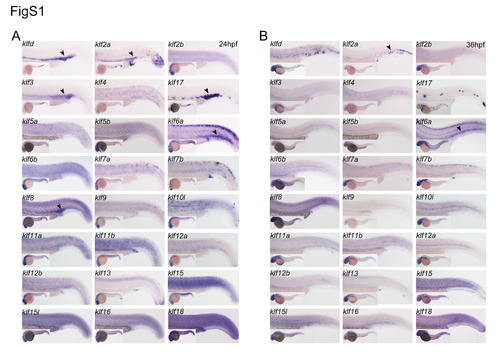
Expression profiling of zebrafish klf genes. (A) The gene expression patterns of klf family at 24 hpf. At this stage, klfd, klf2a, klf3, klf8, klf6a, and klf17 are expressed in hematopoietic tissues including ICM and CHT. The specific expression is indicated by arrowheads in black. (B) The expression patterns of Klf family in zebrafish at 36 hpf. The black arrowheads indicate expression of klf2a and klf6a in CHT. |
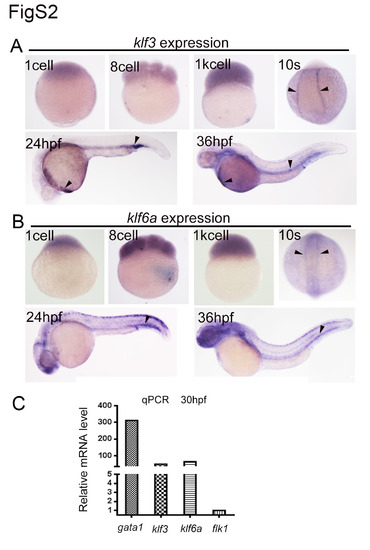
Expression of klf3 and klf6a during zebrafish embryogenesis. (A) Expression of klf3 from 1-cell stage to 36 hpf. klf3 is ubiquitously expressed before 1K cell stage at low level, but after bud stage, is expressed in PLM at 10 somite stage, then in ICM region at 24 hpf. At 36 hpf, expression of klf3 is detected in hatching gland and pronephric duct. The black arrowheads indicate the specific expression. (B) Expression of klf6a from 1-cell stage to 36 hpf. klf6a expression begins from 1-cell and then is observed in neural plate and notochord at 10 somite stage. klf6a is expressed in dorsal neurons and blood vessels including head and caudal region at 24 hpf and 36 hpf. The expression of klf6a is marked by arrowheads. (C) The expression of klf3 and klf6a was determined by qPCR using gata1 positive cells sorted from flk1:GFP/gata1:dsRed transgenic embryos by flow cytometry. gata1 expression was used as positive control and flk1 as negative control. |
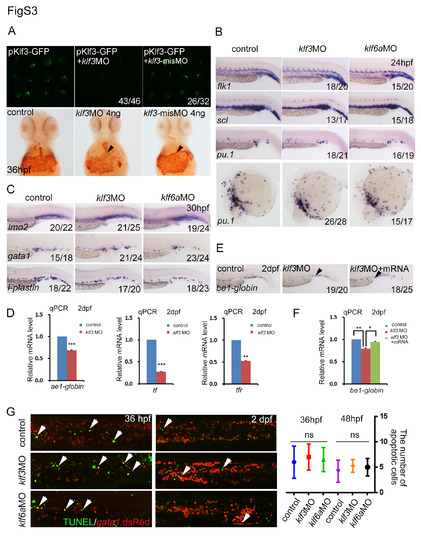
Validation of phenotypes in morphants. (A) Upper panels, the pKlf3-GFP plasmid alone was injected into wild type embryos and GFP expressed normally (left). GFP expression was decreased or disappeared when co-injected with pKlf3-GFP plasmid and klf3MO (middle), while not altered with klf3 utr-misMO injection at the same dose of 4ng per embryos; lower panels, the O-dianisidine staining was attenuated in embryos injected with klf3MO but not with klf3 misMO, compared to controls. (B) The WISH data showed normal expression of flk1, scl and pu.1 when klf3 or klf6a was knocked down at 24 hpf. (C) The EMP markers lmo2, gata1 and l-plastin expression were not changed in both klf3a and klf6 morphants at 30 hpf. (D) The real-time PCR showed ae1-globin, tf and tfR expression was reduced in klf3 morphants at 2 dpf (mean ± SD, t-test, ***P<0.001, *P<0.05, n = 3). (E, F) The WISH and qPCR results showed that the expression of be1-globin was rescued by klf3 mRNA (with sequence that does not overlap with MO) in klf3 morphants (mean ± SD, t-test, **P<0.01, *P<0.05, n = 3). (G) Left panels, TUNEL assay displayed no significant changes in both morphants at 36 hpf and 2 dpf, compared to control embryos (the arrowheads indicate the apoptosis signals); right panel, the quantification of TUNEL signals. |
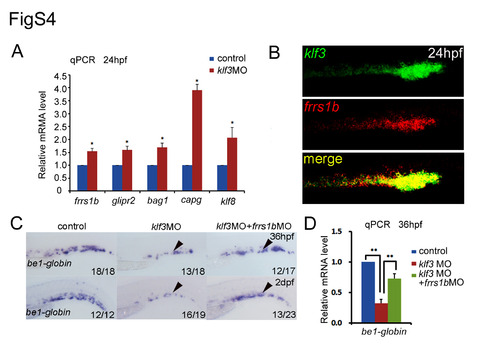
frrs1b acts downstream of klf3 in vivo. (A) qPCR analysis of the predicted genes (frrs1b, glipr2, klf8, capg, and bag1) at 24 hpf in the dissected trunk region in klf3 morphants showed that their relative expression was increased significantly (mean±SD, *P<0.05). (B) Double fluorescence in situ hybridization using klf3 fluorescence-label probe and frrs1b DIG-label probe. The yellow staining showed the co-expression of klf3 (green) and frrs1b (red). (C, D) The WISH and qPCR results showed that the expression of be1-globin was partially rescued when injected frrs1bMO into klf3 morphants at 36 hpf and 48 hpf. |
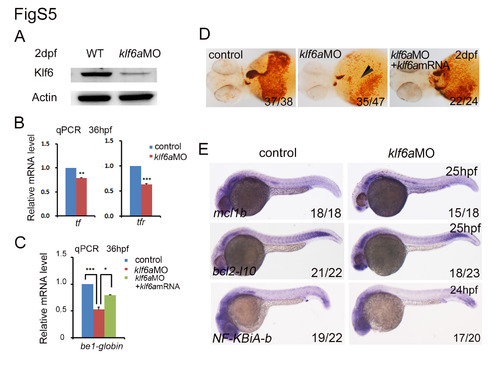
Validation of klf6a MO efficiency and expression of klf6a predicted target genes. (A) Western blot was used to test the Klf6 protein level in klf6a morphants. The results showed that Klf6 was decreased remarkably after knocking down klf6a at 2 dpf. (B) The expression of tf and tfR was reduced in klf6a morphants (mean ± SD, t-test, ***P<0.001, **P<0.01, n = 3). (C, D) The qPCR result and O-dianisidine staining displayed that the be1-globin expression and hemoglobin staining were rescued when co-injected klf6a mRNA compared to klf6a morphants (mean ± SD, t-test, ***P<0.001, *P<0.05, n = 3). (E) The WISH profiles included bcl2-l10, mcl1b and NF-KBiA-b showed no difference in controls and morphants at stages 24-25 hpf. |
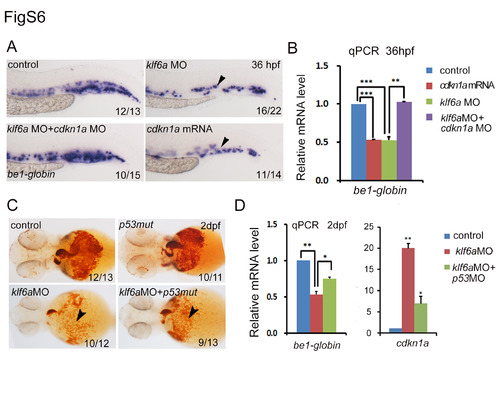
Klf6a represses cdkn1a in two different manners: p53-dependent and p53-independent. (A, B) The WISH and qPCR assay showed that the be1-globin expression (arrowheads) was reduced when overexpression of cdkn1a or knockdown of klf6a and the defect was rescued by co-injection of cdkn1a MO into klf6a morphants (mean ± SD, t-test, ***P<0.001, **P<0.01, n = 3). (C) O-dianisidine staining positive cells were decreased dramatically in klf6a morphants and modestly decreased in p53 mutants embryos injected with klf6aMO. The arrowheads mark o-dianisidine staining positive cells. (D) qPCR analysis showed that be1-globin expression was reduced and cdkn1a was still up-regulated in embryos co-injected with klf6aMO and p53MO, compared to klf6a morphants (mean ± SD, t-test, **P<0.01, *P<0.05, n = 3). |

Double knockdown of klf3 and klf6a in zebrafish. In double knockdown embryos, both o-dianisidine staining of hemoglobin (A, black arrowheads) and expression of be1-globin (B, black arrowheads) were attenuated more severely compare to single knockdown; whereas the number of gata1 (C, black arrows) labelled erythroid progenitors was increased in klf morphants, accordingly. |
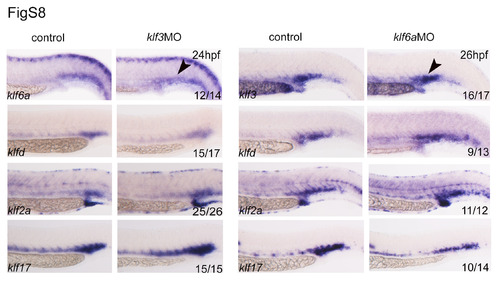
Expression of klf genes in klf3 or klf6a morphants. The expression of klfd, klf2a and klf17 showed no obvious changes in klf3 and klf6a morphants, compared with controls. Note that the expression of klf3 and klf6a was not regulated reciprocally by each other. |
Reprinted from Developmental Biology, 403(2), Xue, Y., Gao, S., Liu, F., Genome-wide Analysis of the Zebrafish Klf Family Identifies Two Genes important for Erythroid Maturation, 115-27, Copyright (2015) with permission from Elsevier. Full text @ Dev. Biol.