
- Title
-
Sumoylation of CCAAT/enhancer-binding protein α is implicated in hematopoietic stem/progenitor cell development through regulating runx1 in zebrafish
- Authors
- Yuan, H., Zhang, T., Liu, X., Deng, M., Zhang, W., Wen, Z., Chen, S., Chen, Z., de The, H., Zhou, J., Zhu, J.
- Source
- Full text @ Sci. Rep.
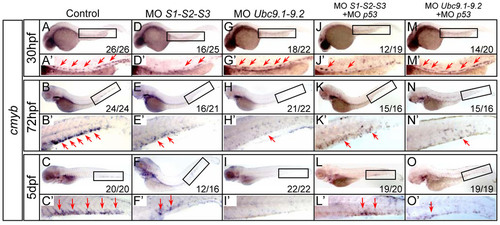
HSPCs are depleted in SUMO-deficient embryos. (A–O) WISH assay of cmyb at 30 hpf (A, D, G, J, M), 72 hpf (B, E, H, K, N) and 5 dpf (C, F, I, L, O). Boxed regions indicate the AGM or CHT, respectively. (A2–O2) Magnified images of corresponding boxed regions from A to O, respectively. Red arrows identify cmyb-positive cells in the AGM or CHT, respectively. MO, morpholino oligonucleotides. |
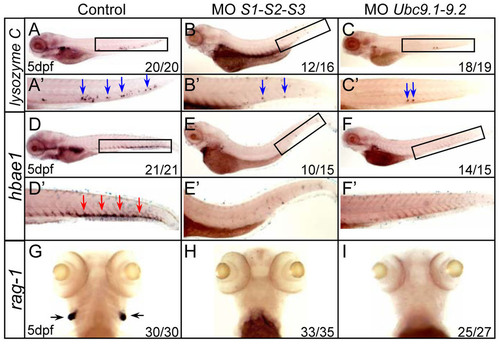
Multiple blood cell lineages are impaired in SUMO-deficient embryos. (A–I) WISH assays of lysozyme C (A–C), hbae1 (D–F) and rag1 (G–I) at 5 dpf. Boxed regions indicate the CHT (A–F). (A′–F′) Magnified images of corresponding boxed regions from A to F, respectively. Blue arrows identify lysozyme C-positive cells in the CHT (A′–C′). Red arrows identify hbae1-positive cells in the CHT (D′–F′). Black arrows identify rag1-positive cells in the thymus (G–I). |

Loss of SUMO reduces HSPC generation and proliferation. (A–C) The vasculature is intact in SUMOs or Ubc9 morphants. WISH assay of flk1 at 30 hpf. (A′–C′) Magnified images of corresponding boxed regions from A to C, respectively. (D–E) The frequency of HSPC generation was reduced in SUMO-deficient embryos. Time-lapse confocal imaging analyses of HSPC generation from Tg (flk1-EGFP) line from 30 to 50 hpf. Representative pictures were captured from Video S1 and Video S2, respectively. Arrowheads indicate the budding cells. DA, dorsal aorta; AV, axial vein. (F) Statistical analyses of the frequency of HSPC generation. Data shown are the mean ± SEM, n = 3, *P < 0.01 by student′s t-test. (G–O) The proliferation of HSPC is reduced in SUMOs or Ubc9 morphants. Double immunostaining of cmyb-EGFP (G–I) and BrdU (J–L) in the CHT of Tg (cmyb-EGFP) line at 72 hpf. The bottom panel shows merged images (M–O). (P) Quantification of BrdU and cmyb-EGFP double positive cells in the CHT of Tg (cmyb-EGFP) line at 72 hpf. Data shown are the mean ± SD, n e 3, *P < 0.01 by student′s t-test. EXPRESSION / LABELING:
PHENOTYPE:
|

Sumoylation of C/ebpα is involved in HSPC development. (A) The expression of cebpa was examined by RT-PCR analysis. EGFP positive cells were sorted from the Tg (cmyb-EGFP) and Tg (gata1-EGFP) transgenic lines at 72 hpf, respectively, and subjected to RT-PCR. As a control, transcripts of the bactin gene were amplified. P.C., positive control (plasmid). N.C., negative control (H2O). (B–F) WISH assay of cmyb at 30 hpf. Boxed regions indicate the AGM. (B′–F′) Magnified images of corresponding boxed regions from B to F, respectively. Red arrows identify cmyb-positive cells in the AGM. (G–I) Fluorescent images of the Tg (cmyb-EGFP) line at 72 hpf. (G′–I′) Magnified images of corresponding boxed regions from G to I, respectively. White arrows identify cmyb-positive cells in the CHT. (J–M) WISH assay of cmyb in the sae1 mutant embryos and siblings at 72 hpf. (N–R) WISH assay of cmyb in the cebpa mutant embryos and siblings at 72 hpf. (J′–R′) Magnified images of corresponding boxed regions from J to R, respectively. Blue arrows identify cmyb-positive cells in the CHT. EXPRESSION / LABELING:
PHENOTYPE:
|
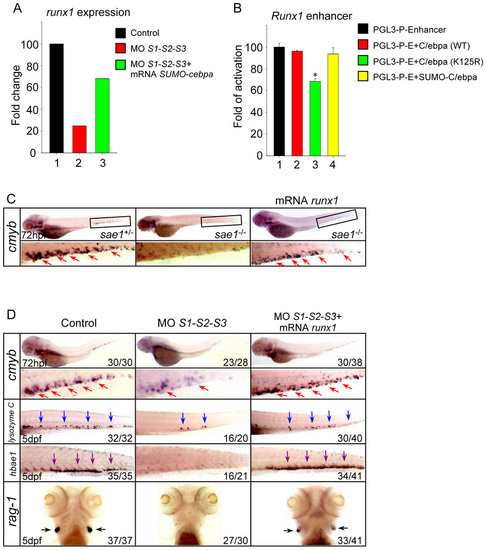
Runx1 is implicated in the hematopoietic defects triggered by SUMO-deficiency. (A) The relative expression level of runx1 revealed by microarray analysis. The result shown is expressed as fold difference compared with the level (set to 100) detected in control embryos. (B) Luciferase activity assays were performed in 293T cells using the various C/ebpα constructs indicated. The Renilla plasmid was used as an internal control. Data shown are the mean ± SD of three independent experiments. *P < 0.05 by student′s t-test. (C) WISH assay of cmyb in the sae1 mutant embryos and siblings at 72 hpf. (D) WISH assay of cmyb at 72 hpf and lysozyme C, hbae1 and rag1 at 5 dpf. Note that runx1 overexpression rescued the hematopoietic defects in the SUMO-deficient embryos. Red, blue, purple and black arrows identify cmyb, lysozyme C, hbae1 and rag1-positive cells, respectively. EXPRESSION / LABELING:
PHENOTYPE:
|