
- Title
-
Pou5f1/Oct4 promotes cell survival via direct activation of mych expression during zebrafish gastrulation
- Authors
- Kotkamp, K., Kur, E., Wendik, B., Polok, B.K., Ben-Dor, S., Onichtchouk, D., Driever, W.
- Source
- Full text @ PLoS One
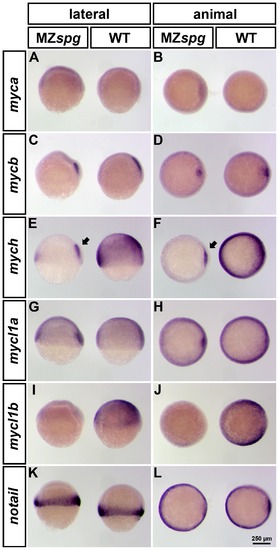
Spatial expression pattern of zebrafish myc genes in WT and MZspg embryos at 60% epiboly. Whole mount in situ hybridization (WISH) analysis of myca, mycb, mych, mycl1a and mycl1b expression in WT (right embryo in each panel) and MZspg (left embryo in each panel). All embryos are shown in lateral (left column) and animal (right column) views with dorsal oriented to the right. All analyzed myc genes are broadly expressed in mid-gastrula embryos, except for c-myc homologues, myca and mycb. mycb is specifically expressed in the shield, whereas myca was not detectable at this stage (A-D). mych and mycl1a in addition have a strong expression domain in the involuting axial mesoderm (E-H). Only mych (E-F) and mycl1b (I-J) depend on the function of Pou5f1 and their expression is strongly decreased in MZspg mutants. However, the mych expression domain in the involuting axial mesoderm is less affected in Pou5f1 deficient embryos (E-F; arrows). We used notail as control, because its expression is not altered in MZspg mutants compared to WT (K-L). EXPRESSION / LABELING:
|

mych and potentially also mycl1b are directly regulated by Pou5f1. Pou5f1 overexpression in MZspg mutants by pou5f1-VP16 mRNA injection into one-cell stage embryos (A-F; left embryos in each panel) and non-injected controls (A, C and E; MZspg middle and WT right embryos in each panel; B, D and F; MZspg right embryo in each panel). The embryos in B, D and F are in addition treated with CHX starting at 1.5 hpf. The mych expression can be rescued by Pou5f1-VP16 in both, CHX treated and untreated embryos, and therefore the regulatory influence of Pou5f1 should be direct (A-B). The expression of mycl1b can also be rescued by Pou5f1-VP16 overexpression in CHX untreated MZspg embryos, but is also strongly upregulated in CHX treated MZspg embryos, even without the injection of pou5f1-VP16 mRNA (C-D). Thus the experiment cannot proove whether activation of mycl1b by Pou5f1 is direct or not. We used notail as negative control, because its expression is independent of Pou5f1 function (E), and depends on zygotic gene products. EXPRESSION / LABELING:
|
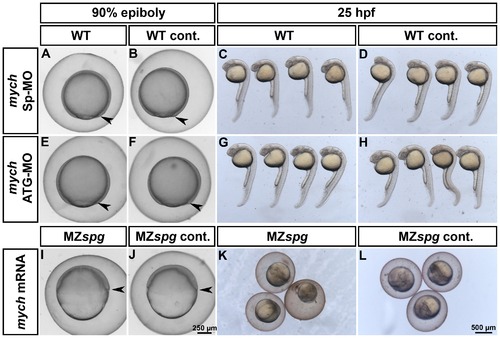
Analysis of the Mych contribution to the morphology of the MZspg mutant phenotype. Knockdown of Mych function in WT by injecting splice-blocking (A-D) or translation-blocking (E-H) morpholinos. Morphological analysis of injected (A,C,E,G) and non-injected (B,D,F,H) embryos at 90%-epiboly and 25 hpf. Morphants show neither a delay in epiboly (A, E) nor obvious morphological defects by 25 hours development (C, G). Rescue of Mych activity in MZspg mutants by injecting mych mRNA into 1-cell stage embryos (I-L). Mych alone is not able to rescue the strong defects developed by Pou5f1 deficient embryos during gastrulation (I) and after 25 hpf (K). PHENOTYPE:
|

MZspg mutants have enhanced apoptosis during gastrulation. TUNEL staining of WT (left embryo in each panel) and MZspg (right embryo in each panel) embryos at distinct embryonic stages between 32 cells and 90%-epiboly. Embryos are shown in animal (left column) and lateral (right column) view. Pou5f1 deficient embryos show enhanced apoptosis, starting at 60%-epiboly, compared to WT (G-J). PHENOTYPE:
|
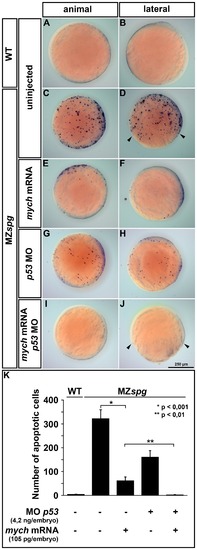
Mych overexpression and p53 knockdown suppress cell death in MZspg gastrulae. TUNEL staining to detect apoptosis at bud stage (A-J) and subsequent computational image analysis (K) for quantification of the number of apoptotic cells. The images show maximum intensity projections of z-stacks taken from single embryos with dorsal to the right. WT embryos display almost no apoptosis, whereas MZspg mutants show an increase in cell death throughout the embryo (A-D). This mutant apoptosis phenotype was partially repressed either by mych overexpression (E,F) or p53 morpholino knockdown (G,H). The co-injection of mych mRNA and p53-morpholino could completely suppress cell death in MZspg mutants, but did not rescue the delay in epiboly movement (I-J; arrowheads). The quantification of cell death (K) revealed that the number of apoptotic cells is decreased by a factor of six in MZspg embryos after mych mRNA injection. By combined knockdown of p53 and Mych overexpression, apoptosis in MZspg embryos was reduced to WT levels. PHENOTYPE:
|
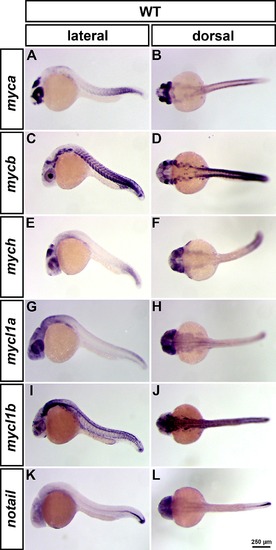
WISH analysis of myc gene expression at 24 hpf. WISH analysis of myca, mycb, mych, mycl1a and mycl1b expression in WT (A-J). All embryos are shown in lateral (left column) and dorsal (right column) view. notail expression was used as control to evaluate stain background levels in the head, where notail is not expressed (K-L). All myc genes show a gene specific expression pattern and are mainly expressed in proliferating and neural tissues. The expression of the c-Myc orthologous genes, myca and mycb (A-D), and of the L-Myc orthologous genes, mycl1a and mycl1b (G-J), show partially complementary patterns. EXPRESSION / LABELING:
|

Morphological analysis of CHX treated and pou5f1-VP16 mRNA injected control embryos. (A) Morphological phenotype of MZspg embryos treated with CHX from 64-cell stage on and developed until WT control embryos reached 60% epiboly. Treated embryos are arrested before sphere stage, but do not degenerate until 60% epiboly equivalent age. (B) The injection of 10 pg pou5f1-VP16 mRNA into 1-cell MZspg embryos is sufficient to rescue the MZspg phenotype, but it also may ventralize the embryo as Pou5f1 overexpression in WT would do [74]. The experiment demonstrates that pou5f1-VP16 was injected in our experiments at concentrations that could be considered physiological for embryonic development. |
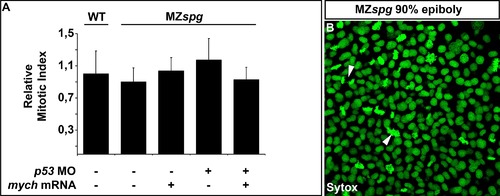
Analysis of the mitotic index at 90%-epiboly. Quantification of the proportion of cells undergoing cell division in WT, MZspg and MZspg injected with mych mRNA and/or p53 morpholinos by calculating the mitotic index (ratio between the total number of nuclei and nuclei undergoing cell division). (A). The calculated mitotic indices are not significantly different between the different genotypes and experimental conditions. Mitotic index of WT embryos was set to 1. Confocal microscopy Z-stacks were taken from the animal region of 90%-epiboly stage embryos, whose nuclei are stained by Sytox fluorescent DNA dye (B). Chromatin is highly condensed during meta- and anaphase of the cell division, which leads to an increase in Sytox stain intensity (B; arrows). |
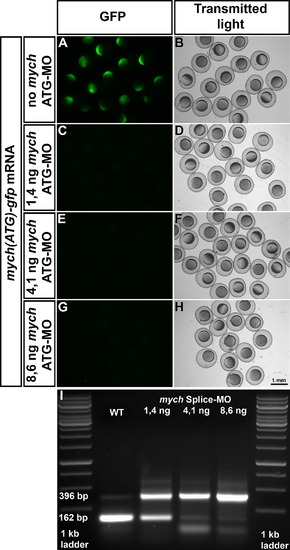
Testing of mych morpholino functionality. (A-H) The functionality of the mych translation-blocking morpholino (ATG-MO) was tested by injecting a fusion mRNA, where the MO target sequence was fused to the gfp ORF at the start ATG, together with different concentrations of the ATG-MO into one-cell stage embryos. The GFP signal was analyzed using fluorescence microscopy (left panel) and the normal morphology of the embryos after morpholino injection was documented using transmitted light microscopy (right panel). The translation of gfp was completely blocked by injecting as little as 1.4 ng of the ATG-MO (C). For the splice-blocking morpholino (Sp-MO) the functionality was tested by RT-PCR using a pair of primers overlapping the second intron (I), whose splicing sites are targeted by the mych-Sp-MO. In WT the 162 bp fragment reflects the proper splicing of the pre-mRNA, whereas after the injection of 4.1 ng or more of mych-Sp-MO the detected fragment contains the intron and its size increased to 396 bp (I). |

Quantification of apoptosis in WT and MZspg embryos at bud stage. Detection of apoptotic cells by TUNEL staining (A) and subsequent computational image analysis (B). The images show a lateral maximum intensity projection of a z-stack taken from a single embryo. (B) The same z-stack after automatic object recognition using Volocity software (Perkin-Elmer), where most of the apoptotic cells are marked in red (B). |