
Fig. S5
- ID
- ZDB-IMAGE-140812-8
- Publication
- Kotkamp et al., 2014 - Pou5f1/Oct4 promotes cell survival via direct activation of mych expression during zebrafish gastrulation
- All Figures
- Figures for Kotkamp et al., 2014
|
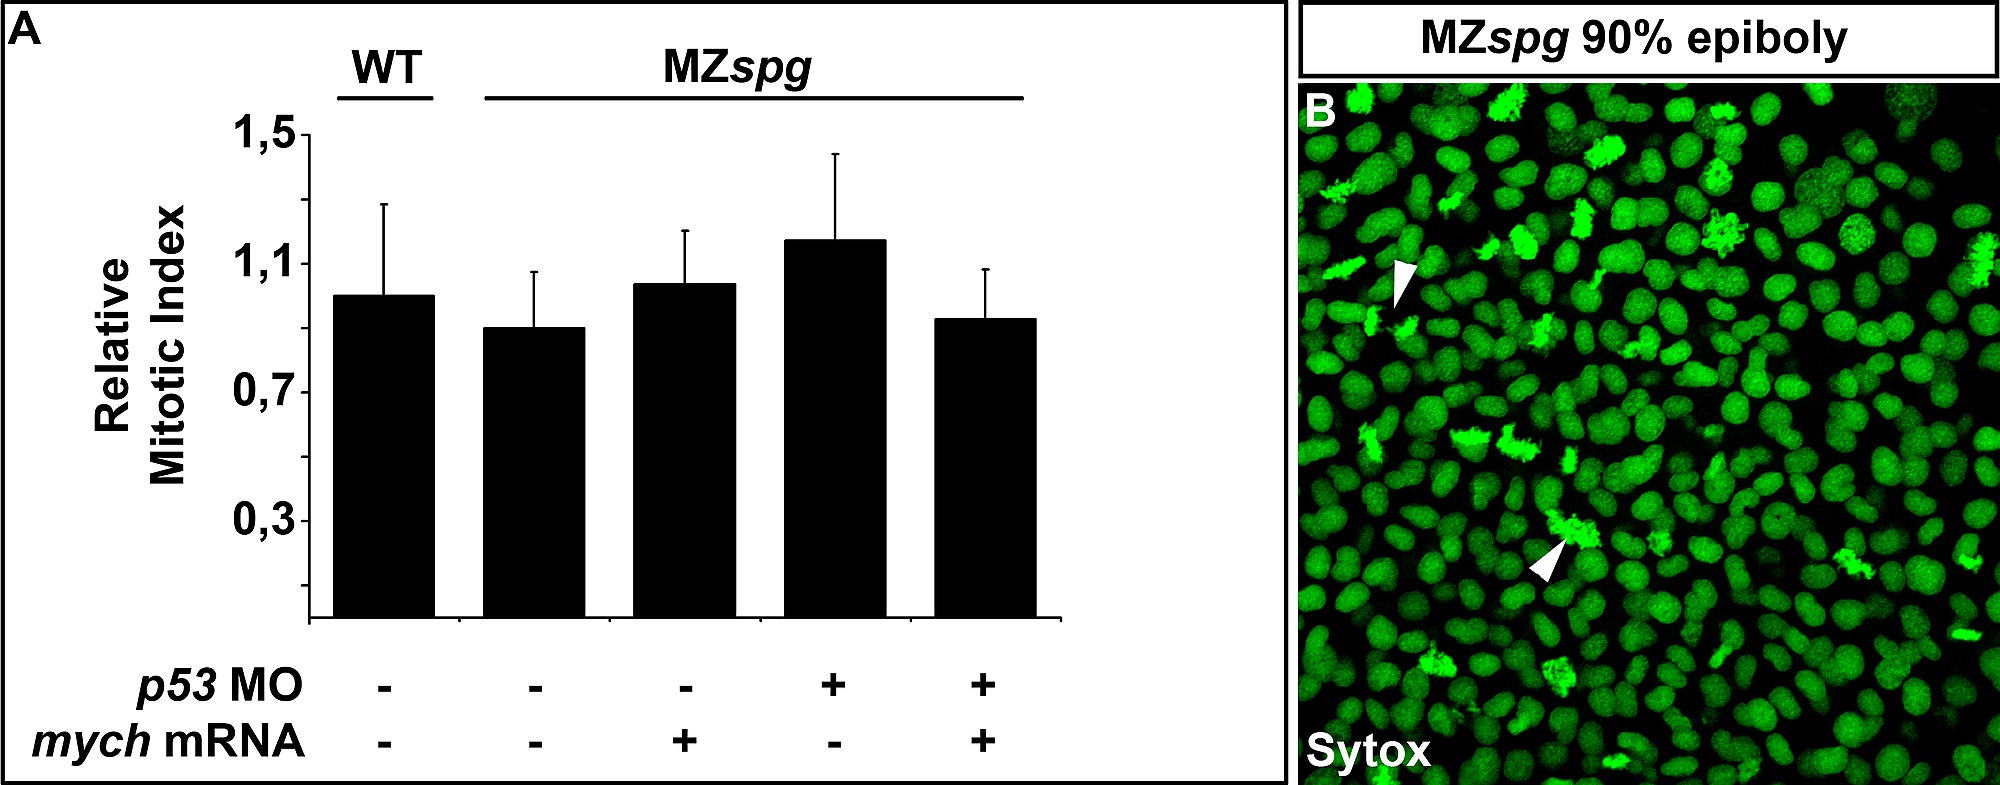
Fig. S5
Analysis of the mitotic index at 90%-epiboly. Quantification of the proportion of cells undergoing cell division in WT, MZspg and MZspg injected with mych mRNA and/or p53 morpholinos by calculating the mitotic index (ratio between the total number of nuclei and nuclei undergoing cell division). (A). The calculated mitotic indices are not significantly different between the different genotypes and experimental conditions. Mitotic index of WT embryos was set to 1. Confocal microscopy Z-stacks were taken from the animal region of 90%-epiboly stage embryos, whose nuclei are stained by Sytox fluorescent DNA dye (B). Chromatin is highly condensed during meta- and anaphase of the cell division, which leads to an increase in Sytox stain intensity (B; arrows).