
IMAGE
Fig. S2
- ID
- ZDB-IMAGE-140812-6
- Genes
- Publication
- Kotkamp et al., 2014 - Pou5f1/Oct4 promotes cell survival via direct activation of mych expression during zebrafish gastrulation
- All Figures
- Figures for Kotkamp et al., 2014
Image
|
Figure Caption
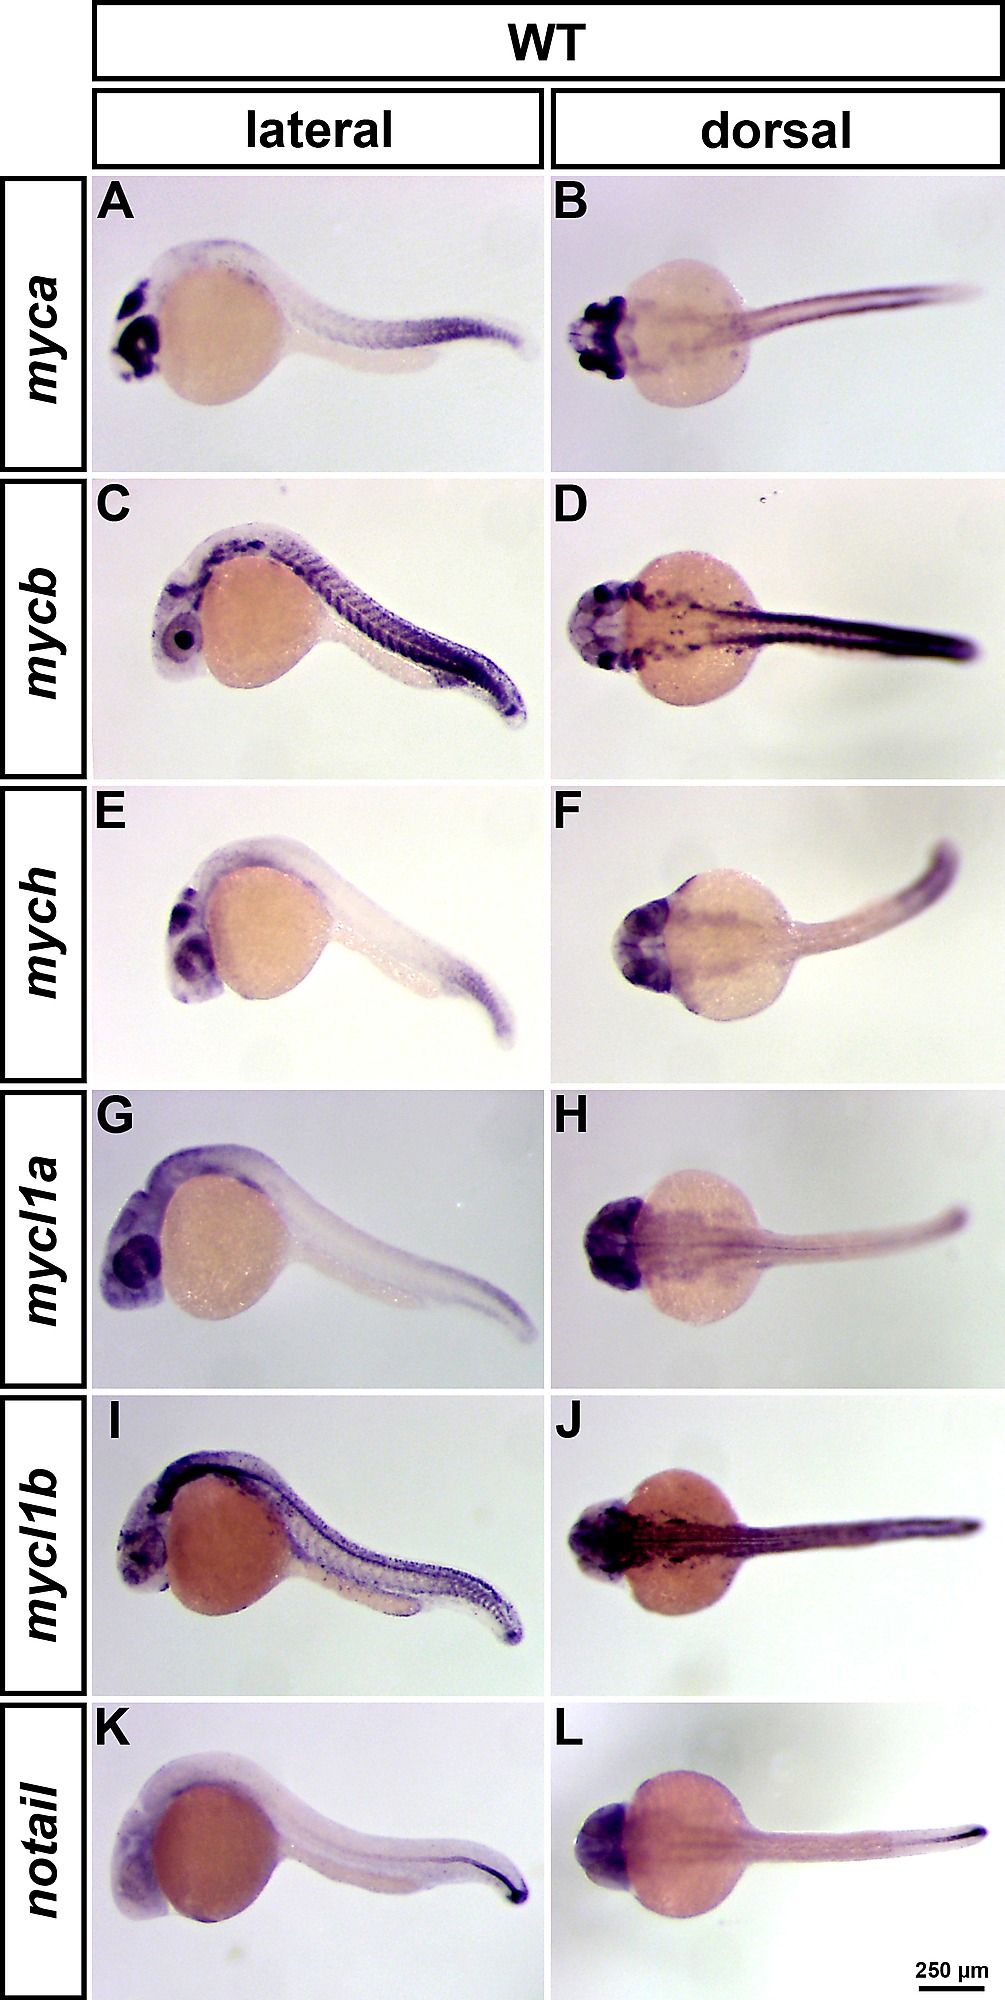
Fig. S2
WISH analysis of myc gene expression at 24 hpf. WISH analysis of myca, mycb, mych, mycl1a and mycl1b expression in WT (A-J). All embryos are shown in lateral (left column) and dorsal (right column) view. notail expression was used as control to evaluate stain background levels in the head, where notail is not expressed (K-L). All myc genes show a gene specific expression pattern and are mainly expressed in proliferating and neural tissues. The expression of the c-Myc orthologous genes, myca and mycb (A-D), and of the L-Myc orthologous genes, mycl1a and mycl1b (G-J), show partially complementary patterns.
Figure Data
Acknowledgments
This image is the copyrighted work of the attributed author or publisher, and
ZFIN has permission only to display this image to its users.
Additional permissions should be obtained from the applicable author or publisher of the image.
Full text @ PLoS One