
Fig. 7
- ID
- ZDB-IMAGE-140812-5
- Publication
- Kotkamp et al., 2014 - Pou5f1/Oct4 promotes cell survival via direct activation of mych expression during zebrafish gastrulation
- All Figures
- Figures for Kotkamp et al., 2014
|
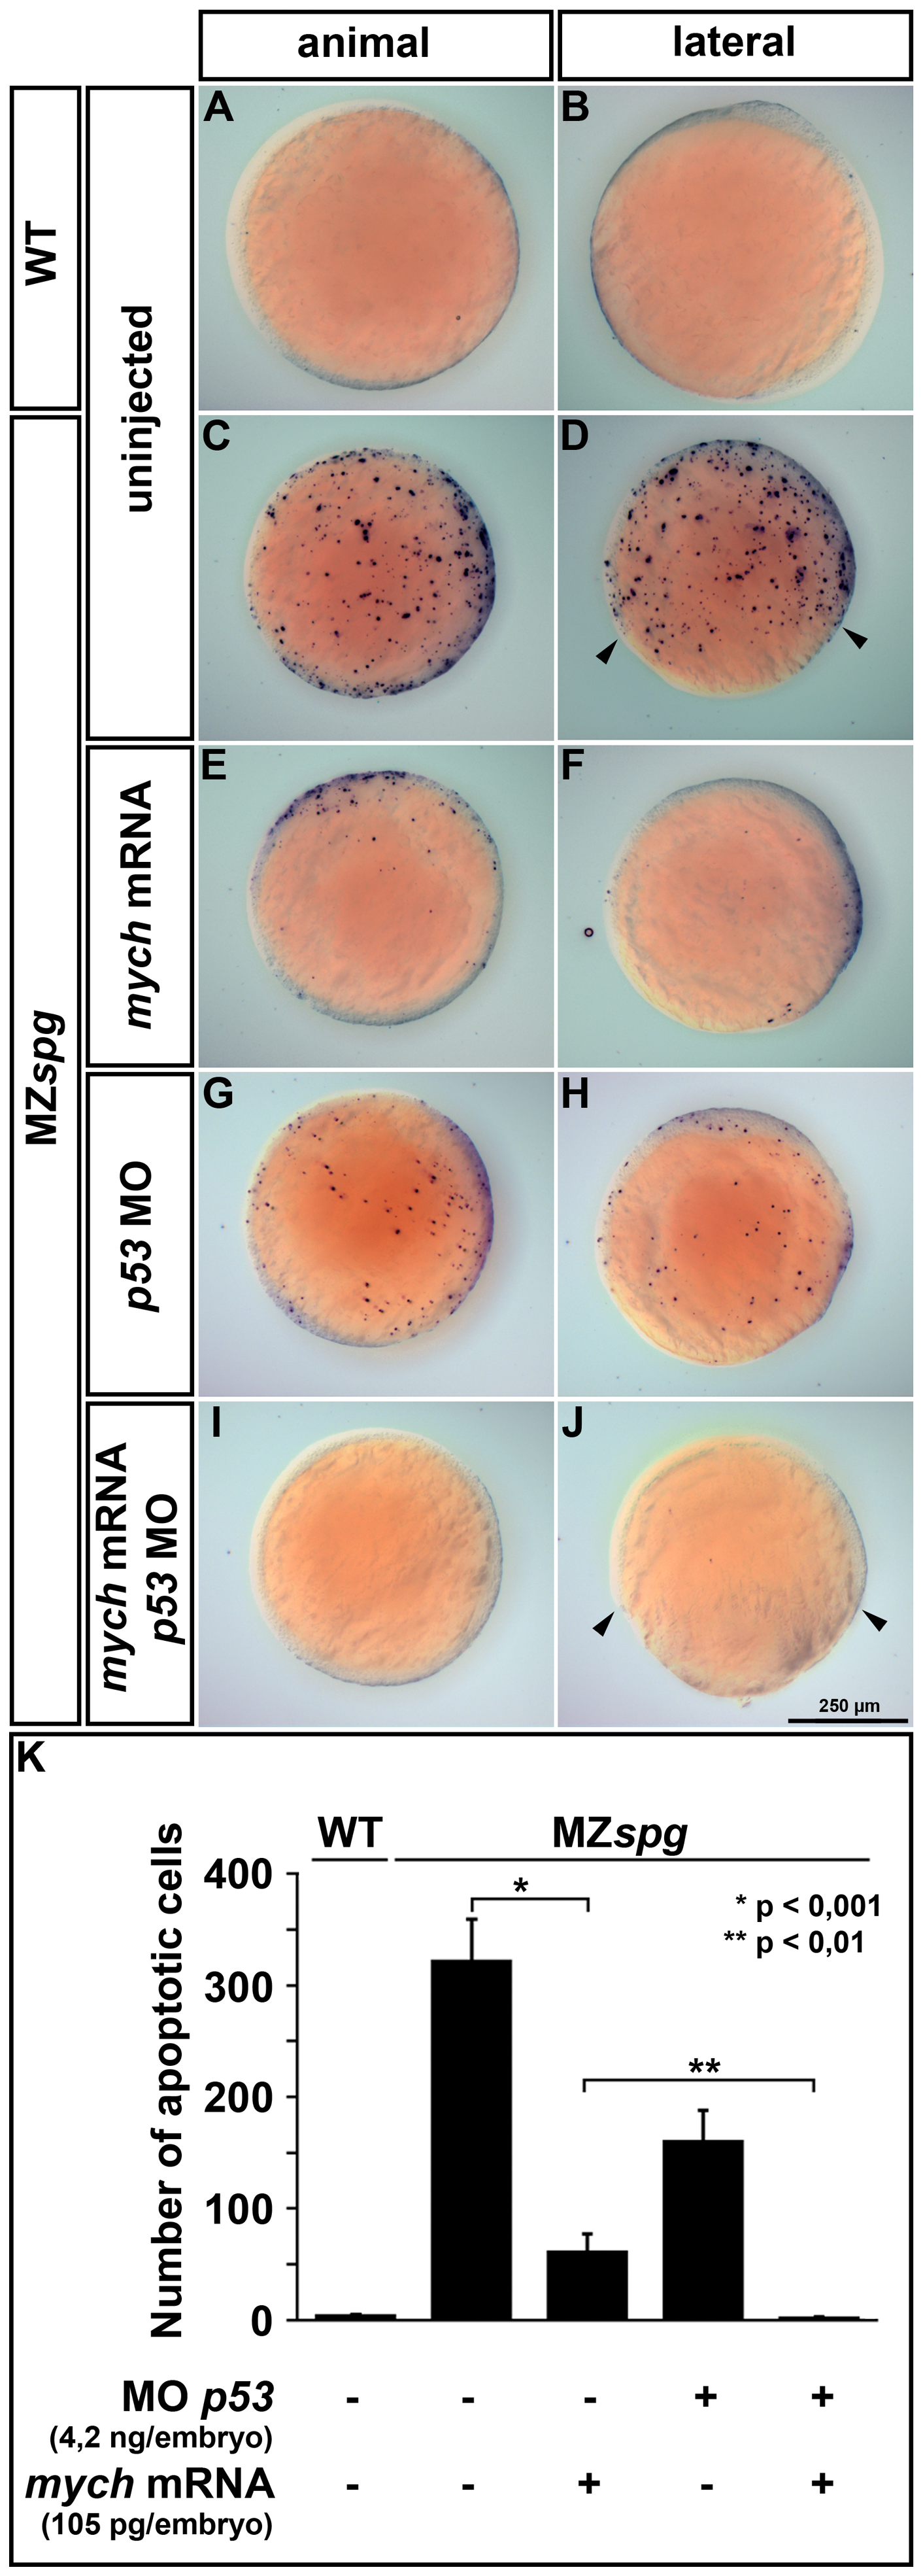
Fig. 7
Mych overexpression and p53 knockdown suppress cell death in MZspg gastrulae.
TUNEL staining to detect apoptosis at bud stage (A-J) and subsequent computational image analysis (K) for quantification of the number of apoptotic cells. The images show maximum intensity projections of z-stacks taken from single embryos with dorsal to the right. WT embryos display almost no apoptosis, whereas MZspg mutants show an increase in cell death throughout the embryo (A-D). This mutant apoptosis phenotype was partially repressed either by mych overexpression (E,F) or p53 morpholino knockdown (G,H). The co-injection of mych mRNA and p53-morpholino could completely suppress cell death in MZspg mutants, but did not rescue the delay in epiboly movement (I-J; arrowheads). The quantification of cell death (K) revealed that the number of apoptotic cells is decreased by a factor of six in MZspg embryos after mych mRNA injection. By combined knockdown of p53 and Mych overexpression, apoptosis in MZspg embryos was reduced to WT levels.